
Table of Contents · 7 Sections
- A1Criteria & Methodology: Define Standards First, Then Review Numbers
- A2Coverage & Consistency
- A3Key Metrics Table: 44.1 kHz → 384 kHz
- A4Key Metrics Table: 44.1 kHz → 705.6 kHz
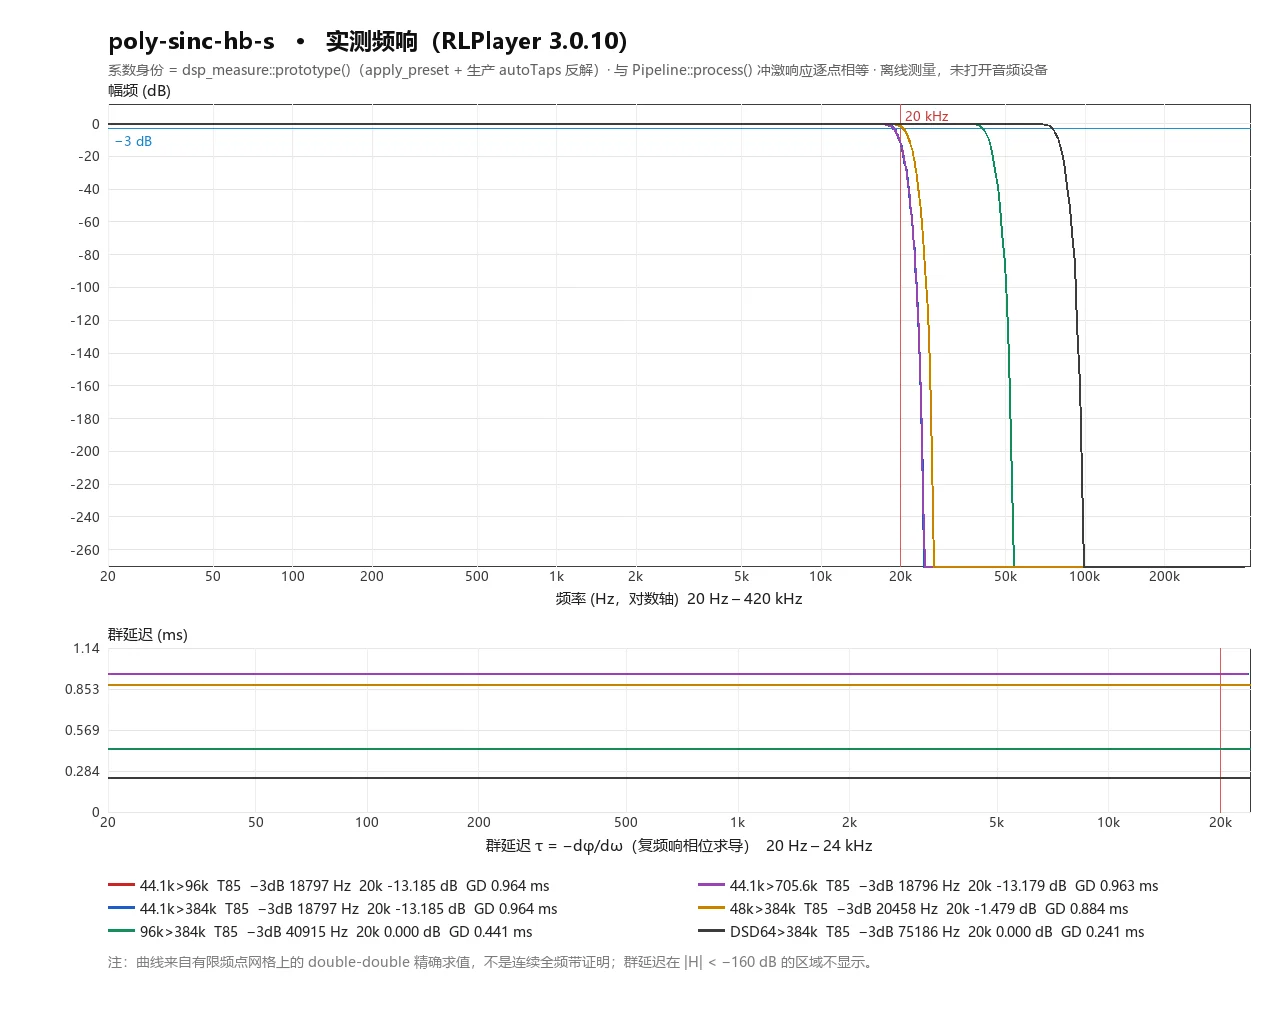
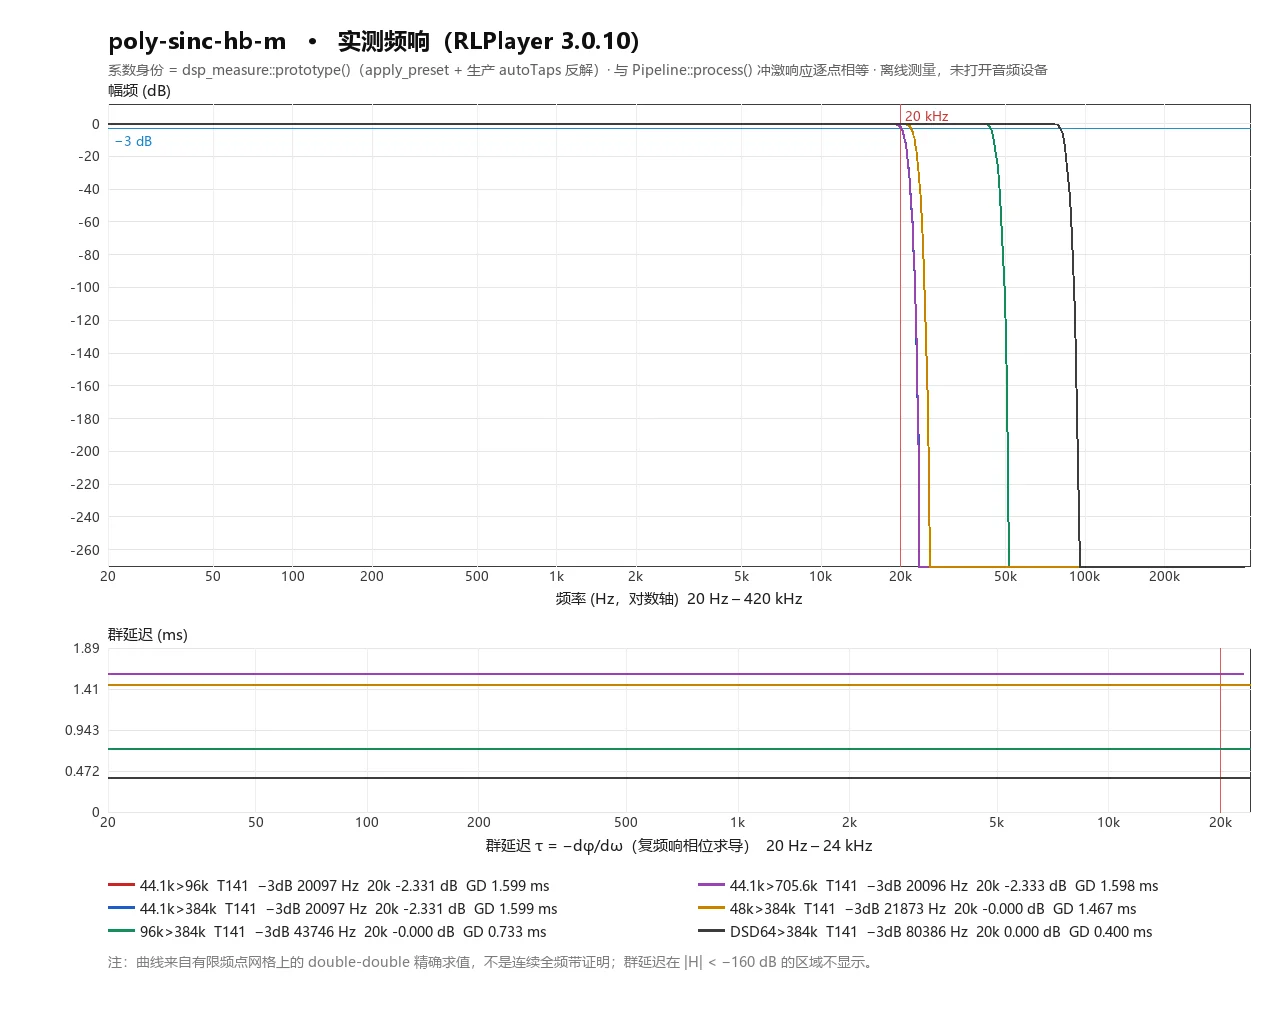
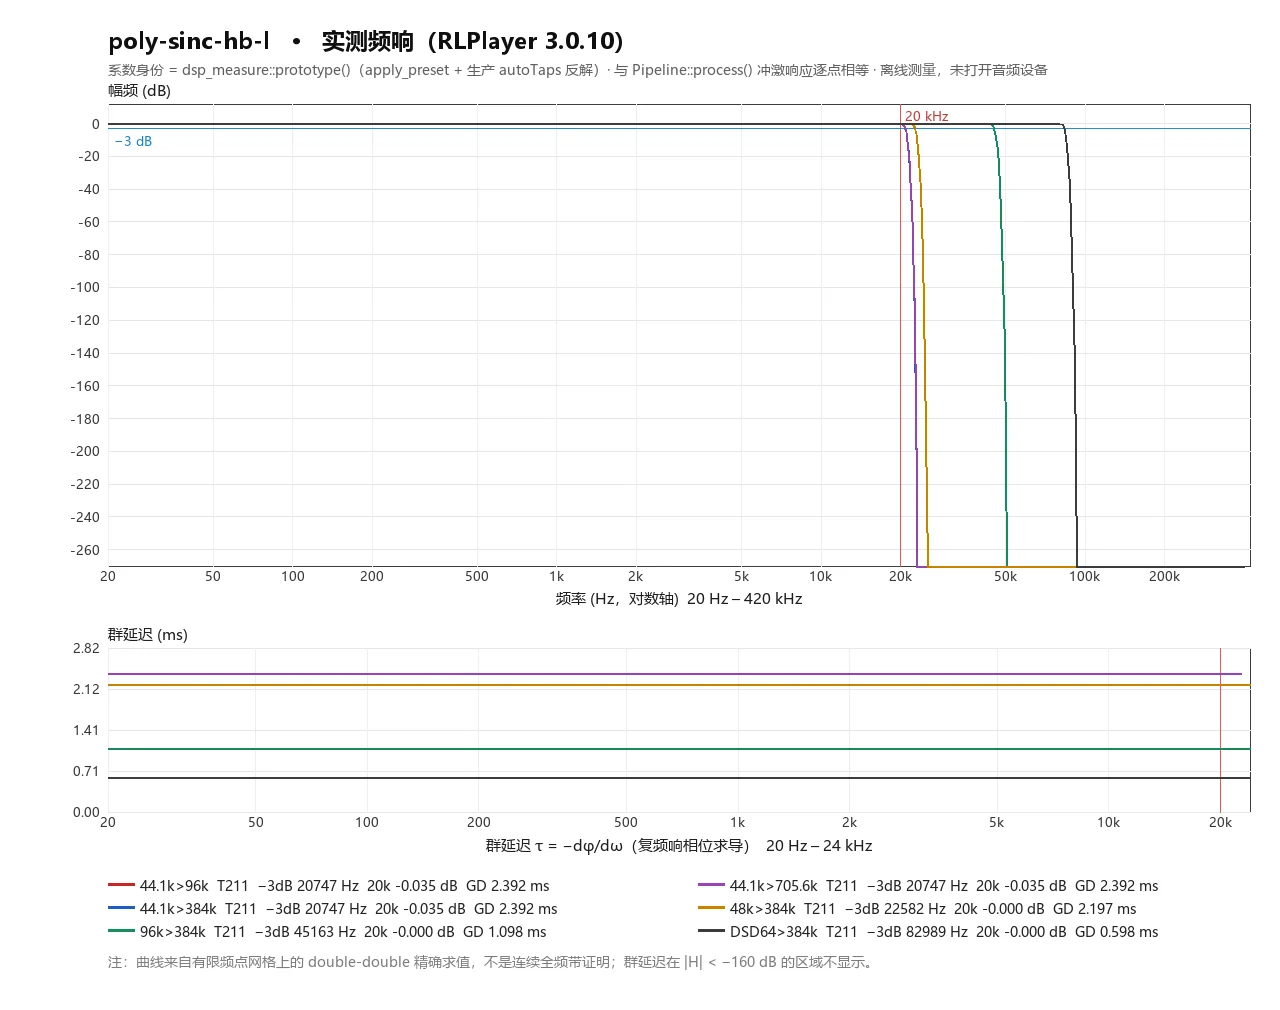
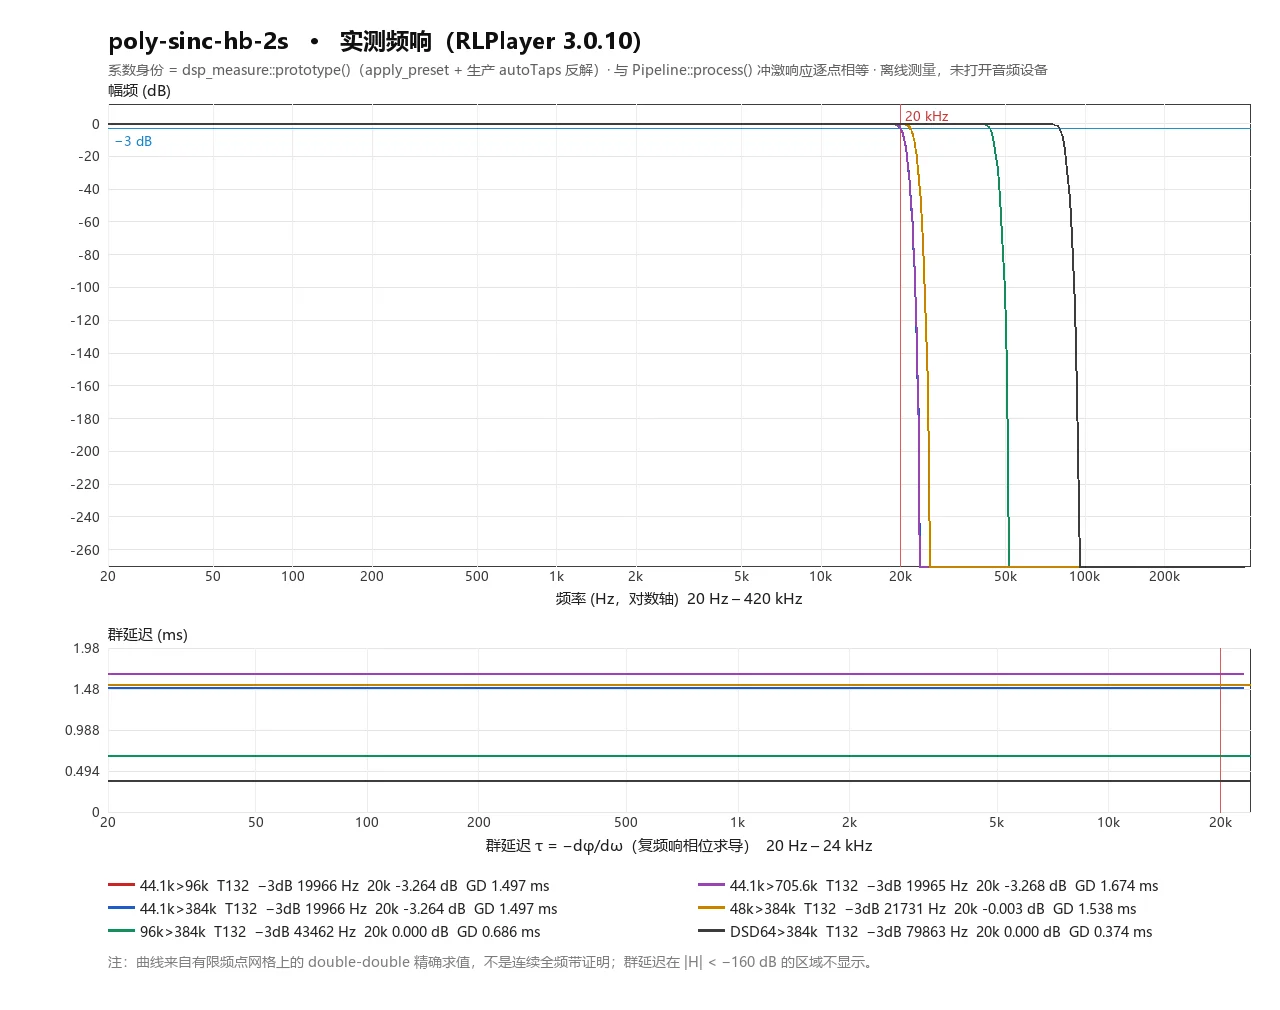
- A5Per-Preset Measured Curves (79 Plots)
- A6Documented Construction Failures in Production Paths
- A7Limitations & Unverified Items
79 named presets across 6 standard sample rate conversion pairs, yielding 474 distinct identities re-measured using production DSP code. This section details evaluation criteria, two key metrics tables, 79 empirical response curves, and limitation statements.
This section answers six core questions for each preset under common sample rate conversion pairs: remaining energy at the audible 20 kHz ceiling; exact −3 dB cutoff frequency; passband ripple magnitude; transition frequency where stopband attenuation drops below −80 dB; worst-case attenuation and frequency within the stopband; group delay and pre/post-ringing durations. It does not address three areas: continuous mathematical proofs across all frequencies, subjective audition verdicts, and quantizer/dither/noise-shaping behavior—this appendix evaluates resampler filters exclusively with unquantized double-precision output.
All figures were measured by tools/fr_probe.cpp on November 1, 2026, running on a development workstation (8-core/16-thread, Windows 11). Raw datasets are archived in build-doc/fr-3.0.10/raw/*.tsv, with replication steps documented in the adjacent README.md. The tested code represents the 3.0.10 filter production codebase; 3.0.11 is an incremental documentation release with no alterations to filter algorithms, retaining 3.0.10 markings on curves and tables. Historical probe code from October 27, 2026, bypassed production autoTaps derivation, yielding differing taps per phase; historical figures must not be mixed with this release.
A.1 Criteria & Methodology: Define Standards First, Then Review Numbers
Every frequency point is evaluated from identical coefficients generated via production paths: dsp_measure::prototype() → review2::production_config() → apply_preset() with production autoTaps solver solve_taps_per_phase(); sharing the exact function and parameters as Pipeline::prepare_stream() when cfg.autoTaps = true. Single-stage filters sample prototype polyphase tables (matching process() execution); cascaded filters (-2s) evaluate true unit impulse responses via process().
| Column | Definition | What This Criterion Proves / What It Cannot Prove |
|---|---|---|
| T | Taps per Phase (Stage 1, Production Value) | Actual taps per phase; not the nominal tap budget in preset tables |
| Prototype Samples | Single-stage = T×L (interpolated prototype); Cascaded = actual impulse length of process() | The same T yields different total sample counts across different conversion pairs |
| 20 kHz Attenuation | 20·log10|H(20000 Hz)|, evaluated precisely with double-double arithmetic | A single-point reading; does not represent worst-case ripple near 20 kHz |
| −3 dB Cutoff | First frequency from low frequencies where response drops to −3.0103 dB; coarse grid search followed by 12-iteration DD logarithmic bisection | Valid strictly within the measured frequency range |
| Passband Ripple | Grid max − min (dB) within [20 Hz, min(20 kHz, 0.95 × passband edge)] | Grid sampling; not a continuous envelope |
| fsb80 | Lowest f where all grid points within [f, fs/2] are ≤ −80 dB; refined via DD bisection | Sampling criterion for "no subsequent resurgence" |
| Min Stopband Attenuation | Maximum value (dB) and frequency of occurrence within [Design Stopband Start, Output Nyquist] | Grid candidates with DD refinement; finite frequencies, not continuous spectrum proof |
| Skirt | Maximum value within [fsb80, Output Nyquist] (legacy table worst_stop standard) | Degenerate metric: by definition ≤ −80 dB; cannot represent overall stopband rejection quality |
| Group Delay | τ = Re{ Σ n·h[n]e^(−jωn) / Σ h[n]e^(−jωn) }, i.e. −dφ/dω; evaluated at 100 Hz / 1 kHz / 10 kHz | Holds true for linear, minimum, and intermediate phase |
| Pre/Post-Ringing | Timestamps of first/last impulse envelope samples exceeding "Peak −60 dB" (relative to peak) | Main lobe width; not an audibility criterion |
Swipe horizontally on smaller screens to view full table
Frequency mapping forms the foundation of all metrics: input audio undergoes L-fold zero-stuffing interpolation, filtering via prototype h, and decimation by factor M. Physical frequency f maps to normalized prototype DTFT frequency ν = 2f/(L·fs_in) (single stage) or 2f/fs_out (cascaded), such that |H(f)| = |DTFT{h}(ν)|. Critical points (20 kHz, −3 dB, worst-case stopband, group delay) are evaluated using double-double precision rather than standard FFT—standard FFT noise floors swamp readings below −250 dB.
The measurement tool validates that it measures production filters before outputting figures: subtracted point-by-point against coefficients exported via filter_report --coefficients, 443 records yield max|Δ| = 0; subtracted point-by-point against unit impulse responses from Pipeline::process() (unquantized double output), 443 records yield max relative error = 0. This self-test is critical: legacy probes once omitted minTapsPerInput solving, erroneously reporting poly-sinc-long-ip at −282 dB (actual: −201 dB), an 81 dB discrepancy. The entire suite operates strictly offline: instantiating resamplers and pipeline objects without opening audio endpoints or emitting audible sound.
A.2 Coverage & Consistency
| Parameter | Value |
|---|---|
| Presets Count (filter_presets() entries) | 79 |
| Sample Rate Combinations | 6 |
| Measured Identity Rows | 474 |
| Successfully Measured | 443 |
| Failed / Skipped | 31 (See A.6) |
| Frequency Response PNGs | 79 Plots (One per preset, dual-panel: Magnitude + Group Delay) |
Swipe horizontally on smaller screens to view full table
Distribution broken down by combination (successful identities only). Note that "Success" counts depend on conversion pairs: 21 presets fail to construct under 44.1 kHz → 384 kHz due to exceeding coefficient budgets, whereas the same presets construct normally under 96 kHz → 384 kHz and 44.1 kHz → 705.6 kHz.
| Combination | Success | 20 kHz Attenuation Min / Median / Max (dB) | −3 dB Median (Hz) | Min Stopband Median (dB) | Skirt Median (dB) | Post-Ringing Median (ms) |
|---|---|---|---|---|---|---|
| 44.1 kHz → 96 kHz | 74 | -16.07 / -0.00 / 0.00 | 21483 | -284.9 | -85.2 | 2.223 |
| 44.1 kHz → 384 kHz | 58 | -16.07 / -0.00 / 0.00 | 21019 | -284.8 | -85.2 | 1.437 |
| 96 kHz → 384 kHz | 79 | -0.00 / -0.00 / 0.00 | 46781 | -283.7 | -81.1 | 1.010 |
| 44.1 kHz → 705.6 kHz | 79 | -16.06 / -0.00 / 0.00 | 21490 | -284.6 | -83.6 | 2.222 |
| 48 kHz → 384 kHz | 79 | -2.91 / -0.00 / 0.00 | 23391 | -284.3 | -82.1 | 2.042 |
| DSD64 → PCM 176.4 kHz → 384 kHz | 74 | -0.00 / -0.00 / 0.00 | 85930 | -284.7 | -84.6 | 0.556 |
Swipe horizontally on smaller screens to view full table
A.3 Key Metrics Table: 44.1 kHz → 384 kHz
One preset per row. T denotes taps per phase (actual production value), not the nominal tap budget in preset tables; Min Stopband reports attenuation in dB and frequency of occurrence; status "Failed to construct" indicates the combination triggers maxPrototypeTaps = 2^21 under 3.0.10 production parameters, causing PolyphaseResampler to reject construction (refusing to silently degrade quality). Complete 14 columns (including prototype samples, passband ripple, worst passband, fsb80, pre-ringing) are archived in the bundled CSV and RESPONSE-TABLE.md.
| Preset | T | 20 kHz (dB) | −3 dB (Hz) | Min Stopband (dB) @ Hz | GD 1 kHz (ms) | Status |
|---|---|---|---|---|---|---|
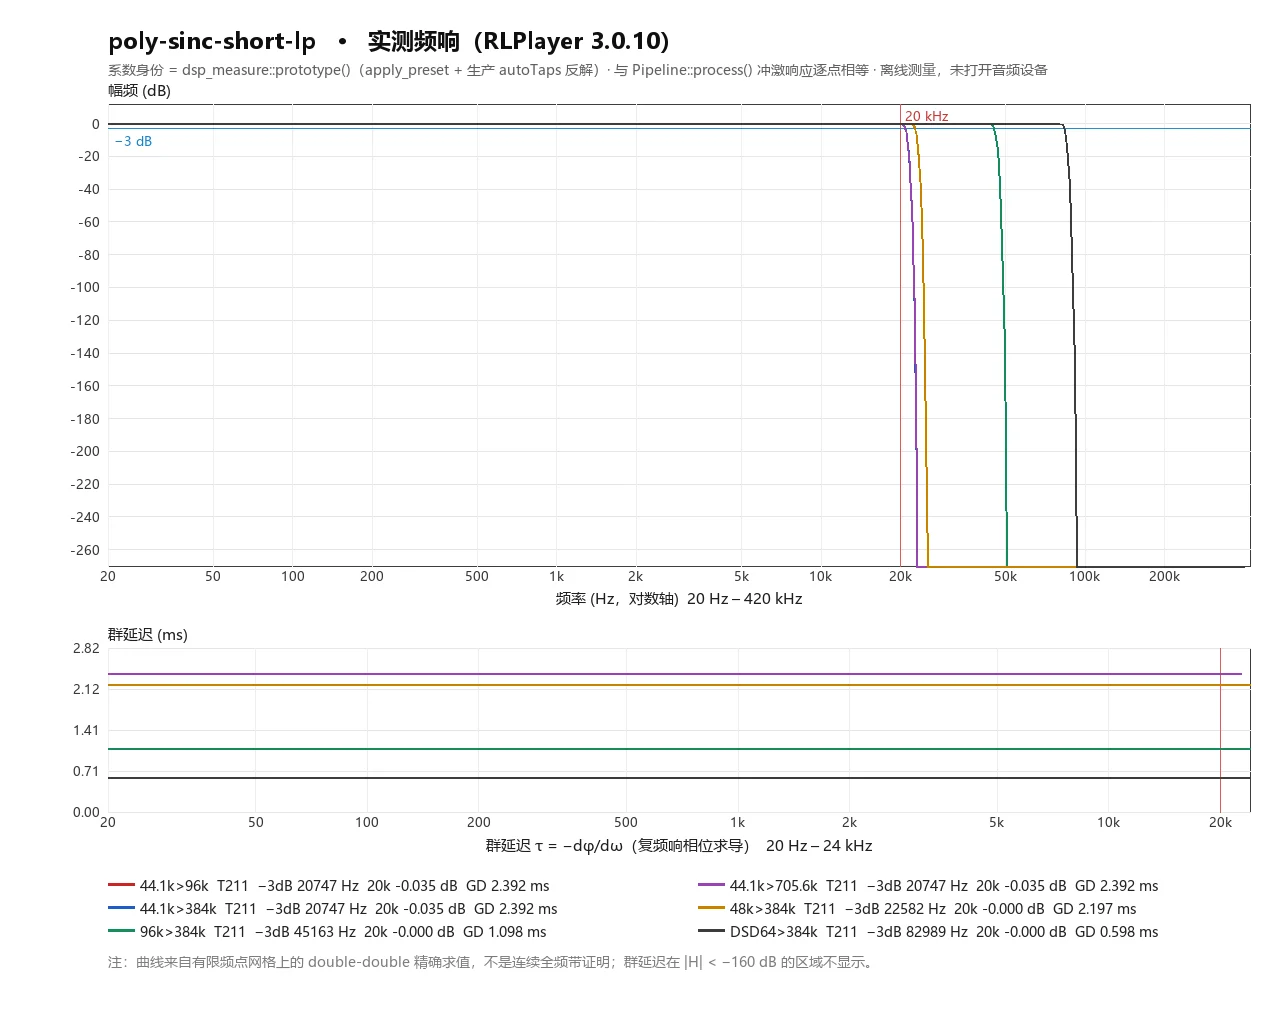
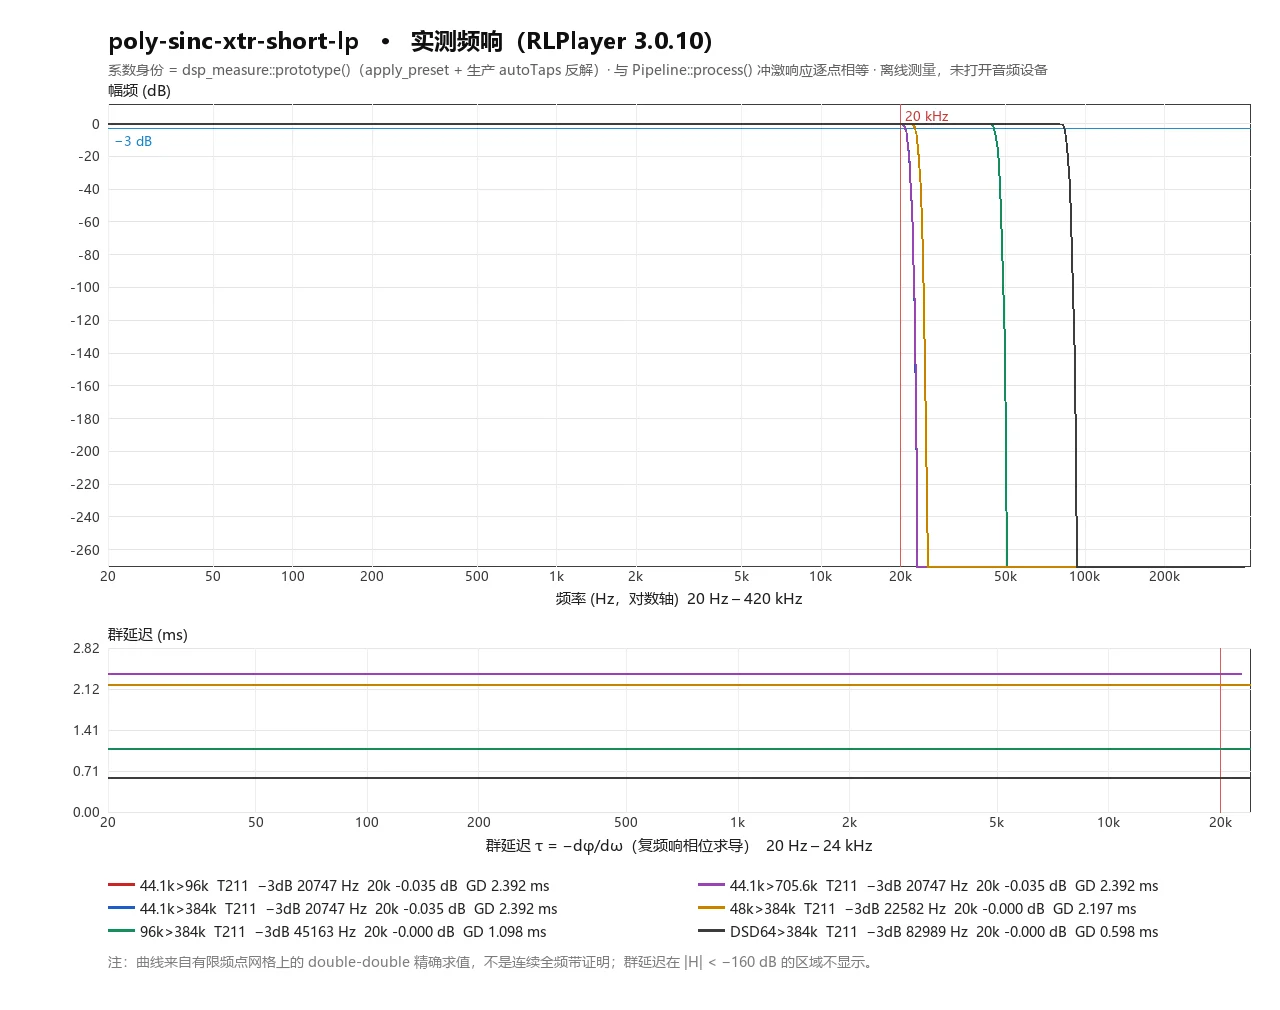
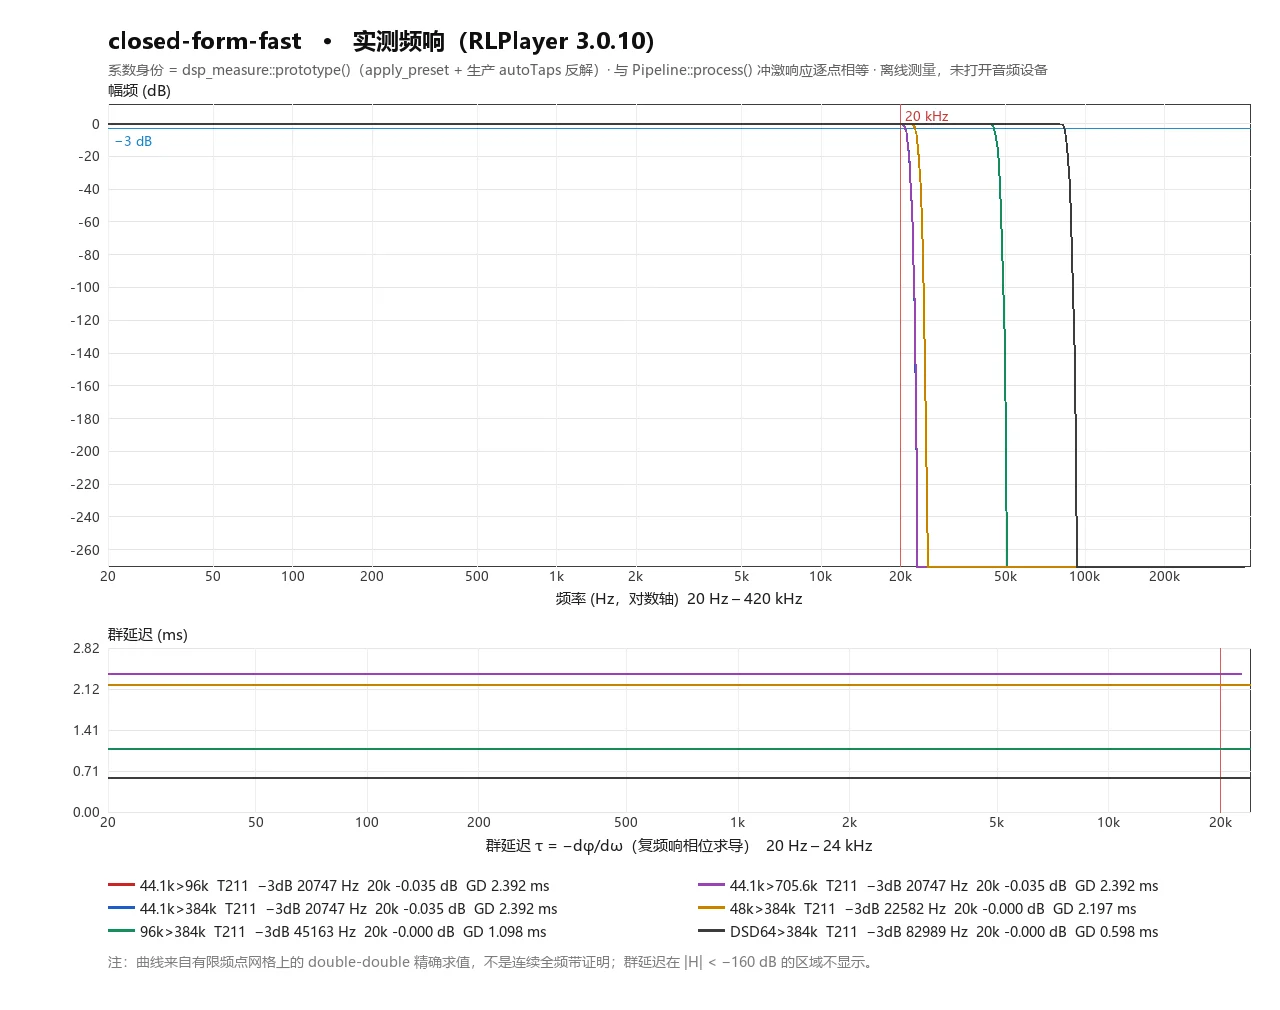
| poly-sinc-short-lp | 211 | -0.035 | 20747 | -284.50 @ 24333 | 2.392 | OK |
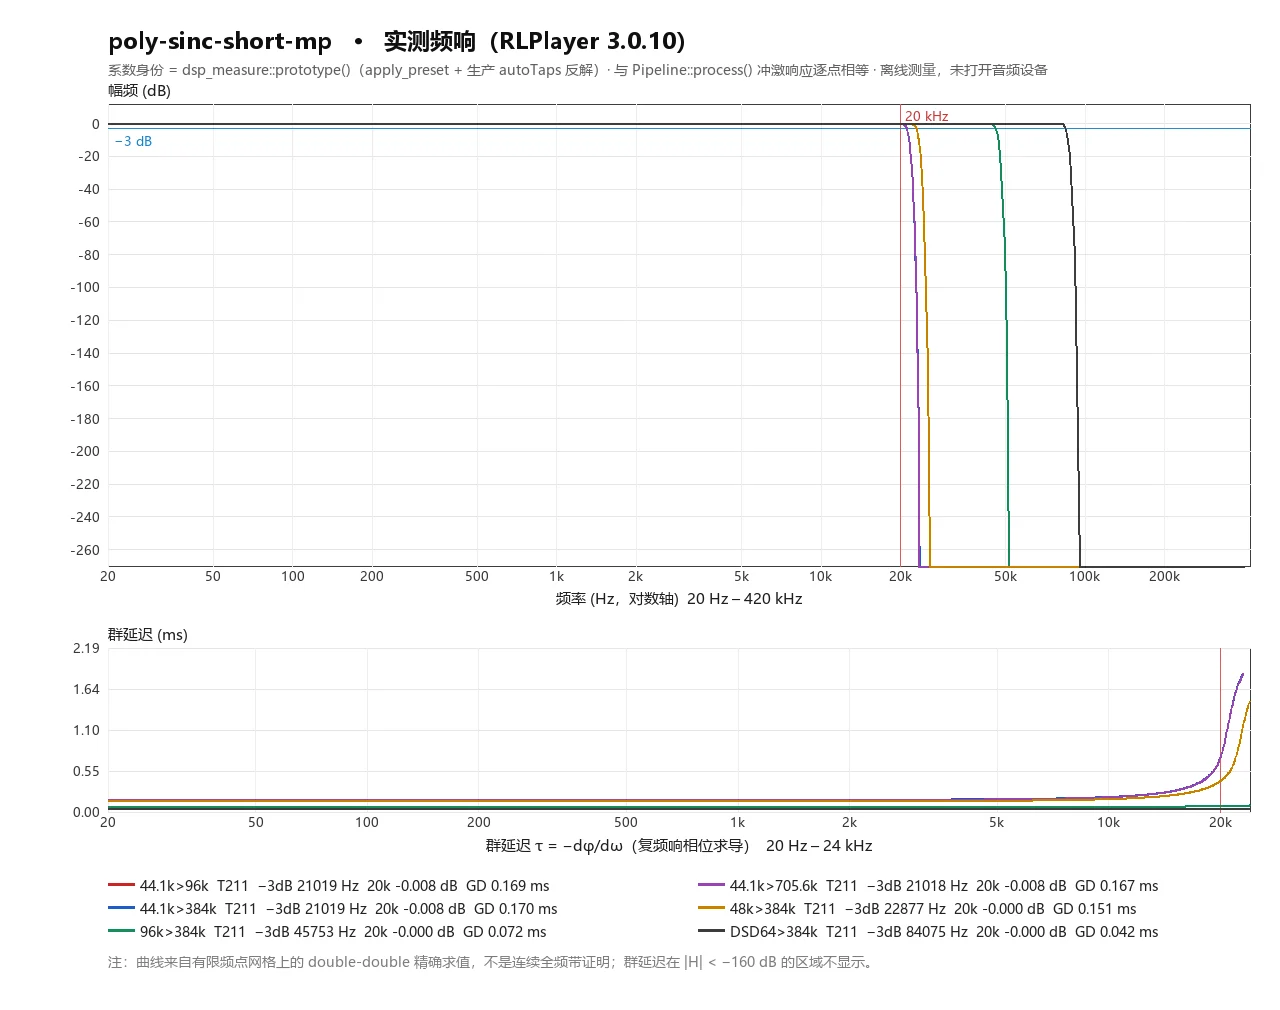
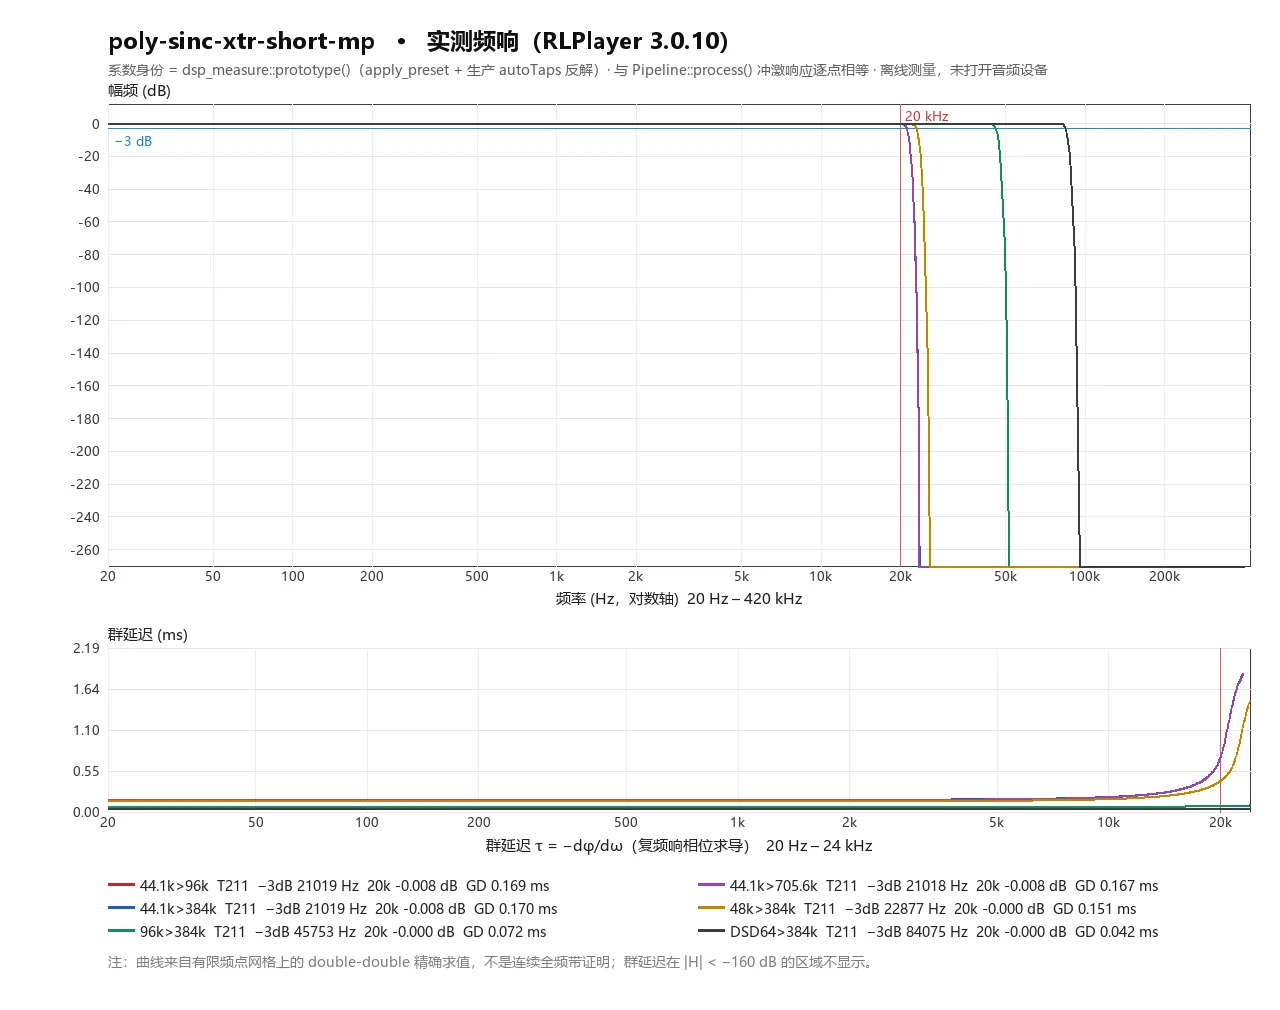
| poly-sinc-short-mp | 211 | -0.008 | 21019 | -284.85 @ 24366 | 0.170 | OK |
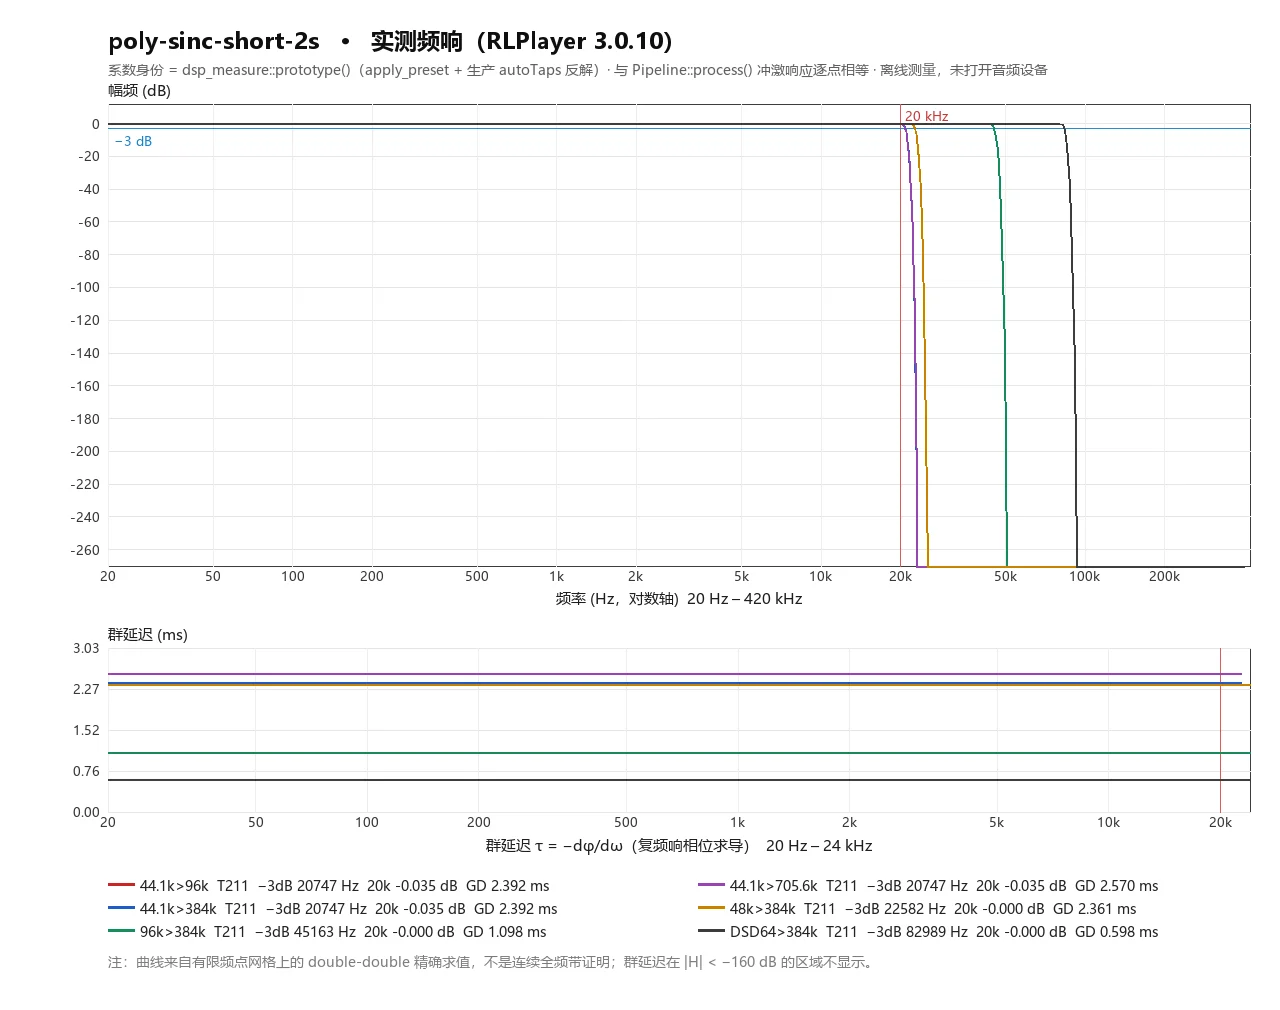
| poly-sinc-short-2s | 211 | -0.035 | 20747 | -284.50 @ 24333 | 2.392 | OK |
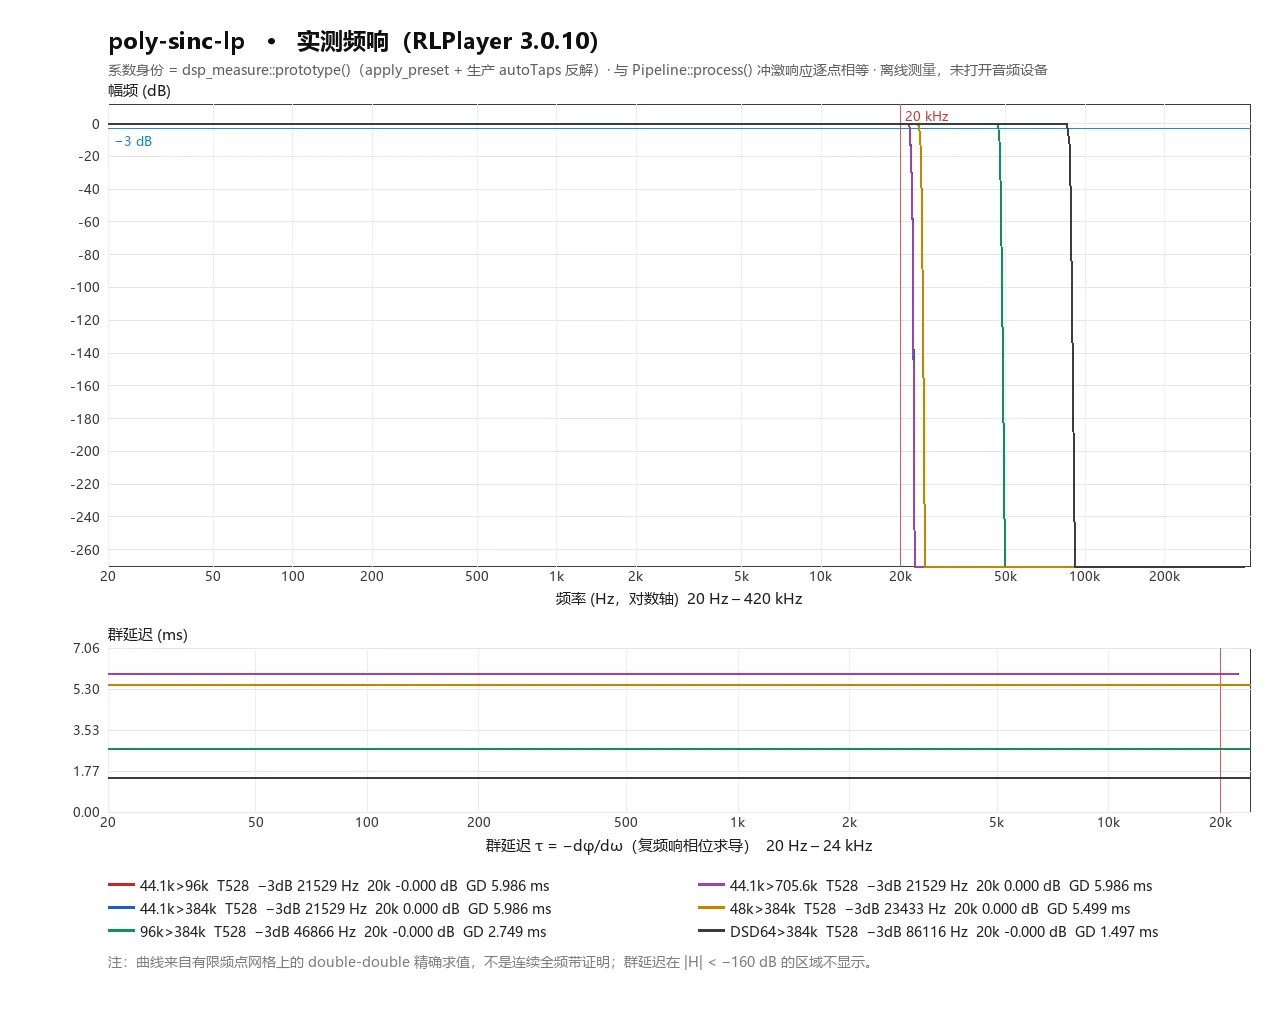
| poly-sinc-lp | 528 | 0.000 | 21529 | -284.70 @ 22963 | 5.986 | OK |
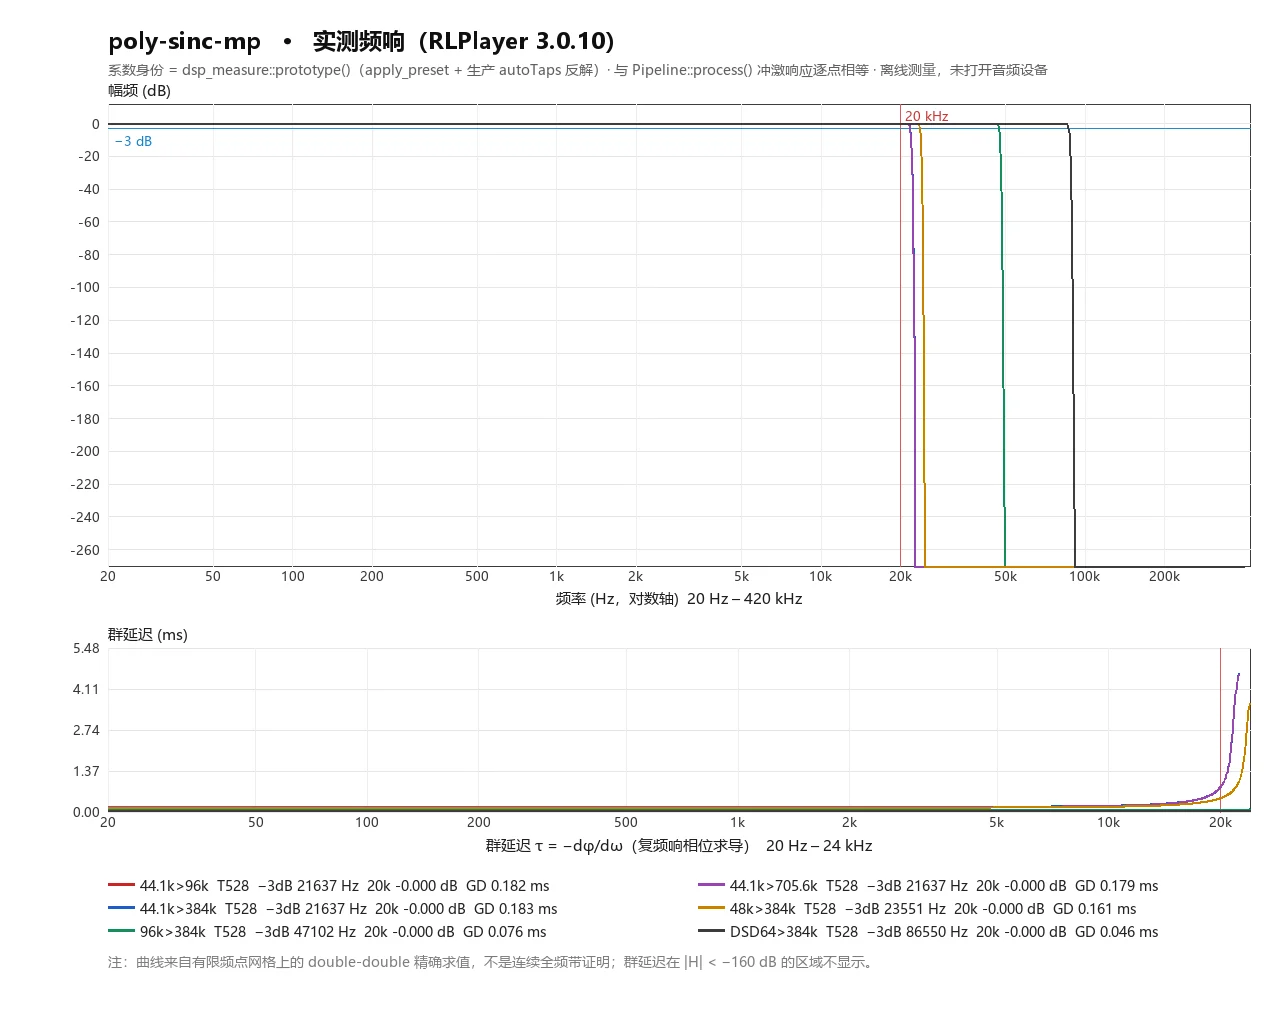
| poly-sinc-mp | 528 | -0.000 | 21637 | -285.16 @ 22973 | 0.183 | OK |
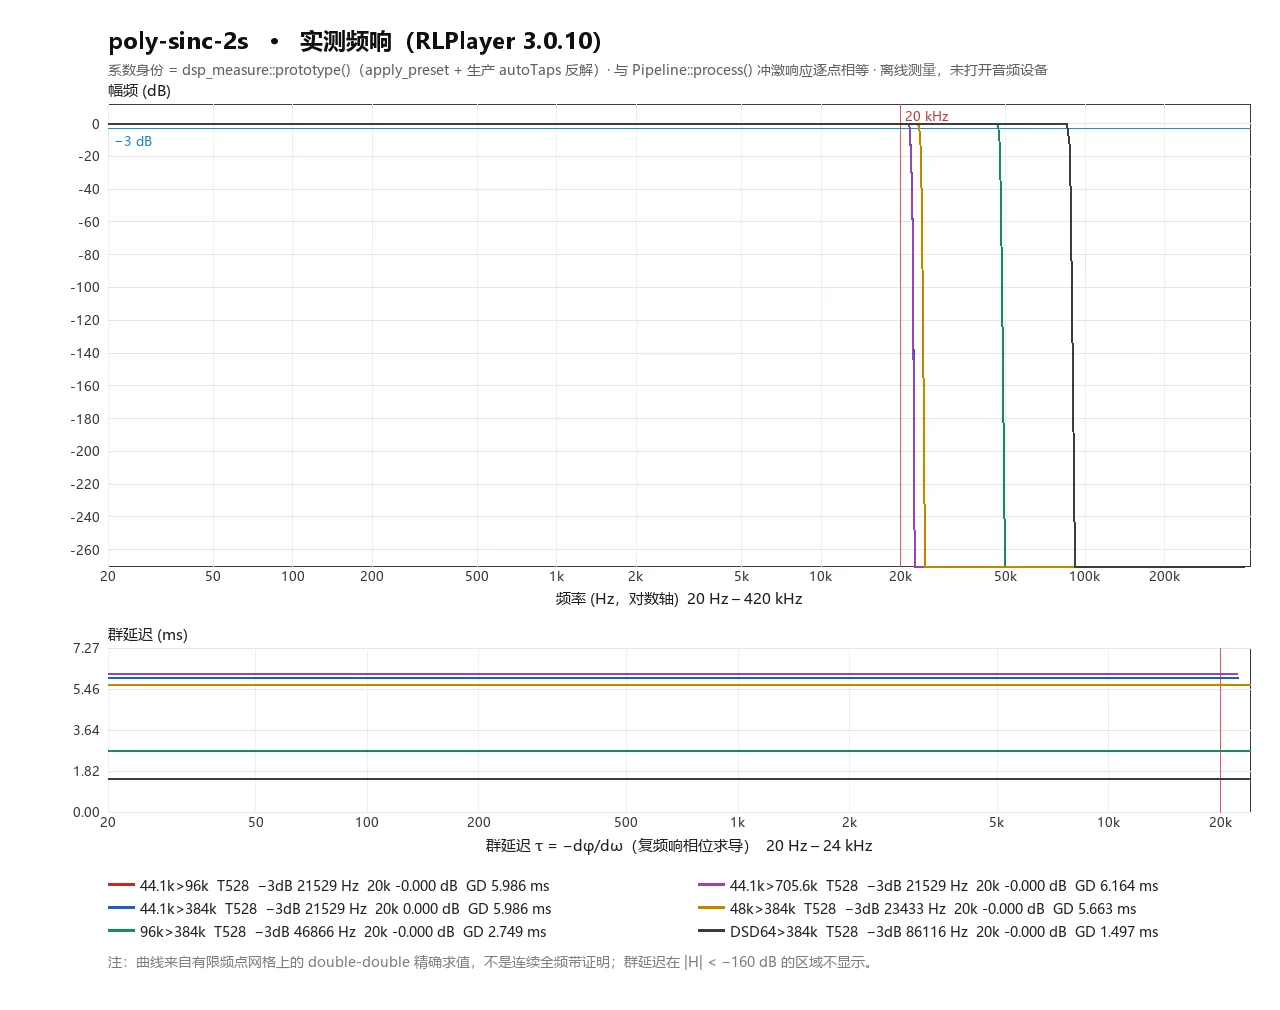
| poly-sinc-2s | 528 | 0.000 | 21529 | -284.70 @ 22963 | 5.986 | OK |
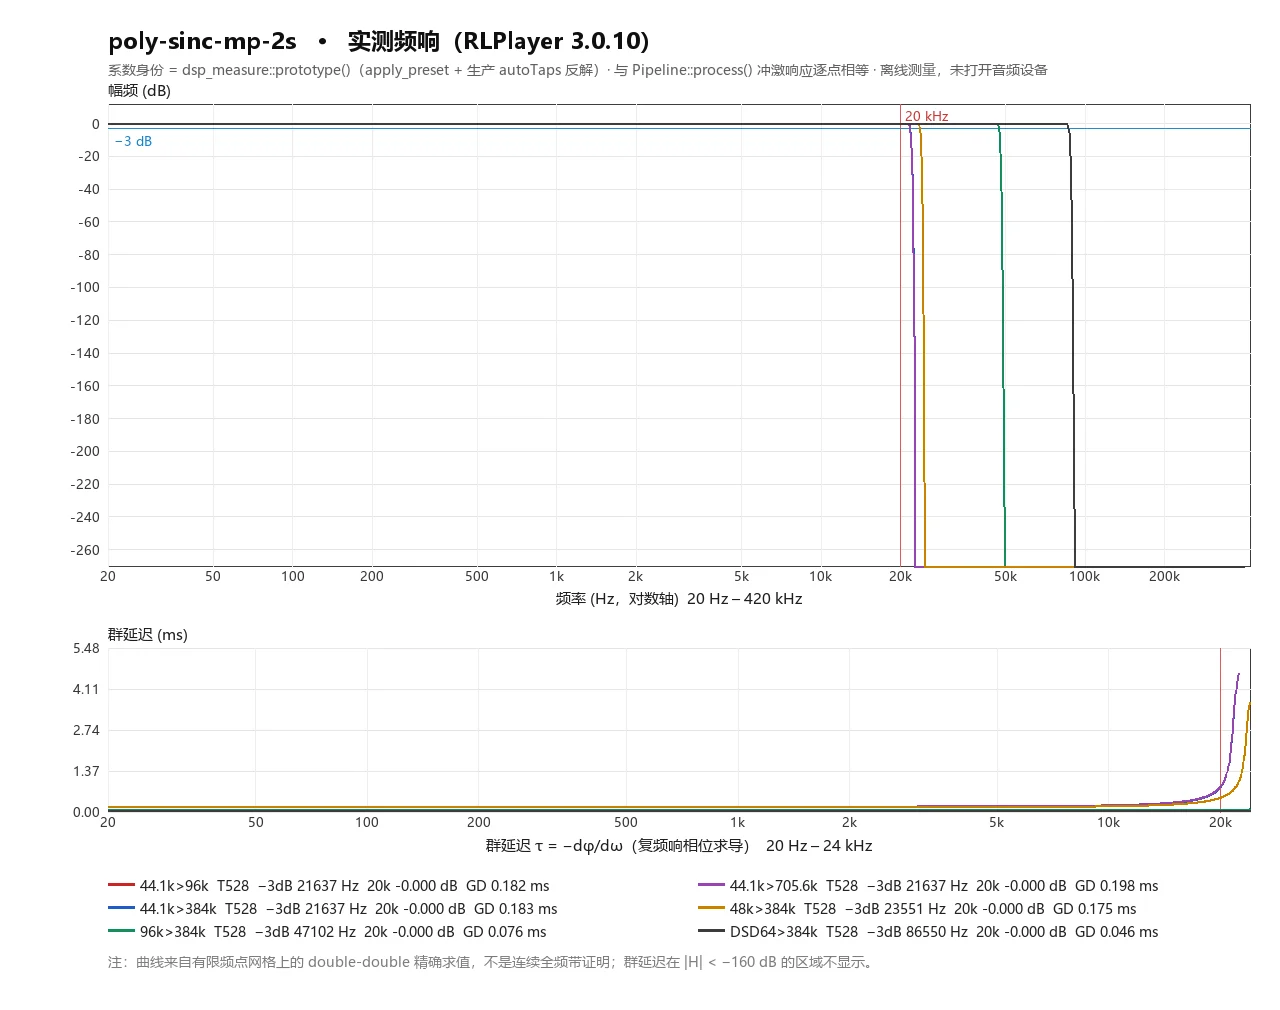
| poly-sinc-mp-2s | 528 | -0.000 | 21637 | -285.16 @ 22973 | 0.183 | OK |
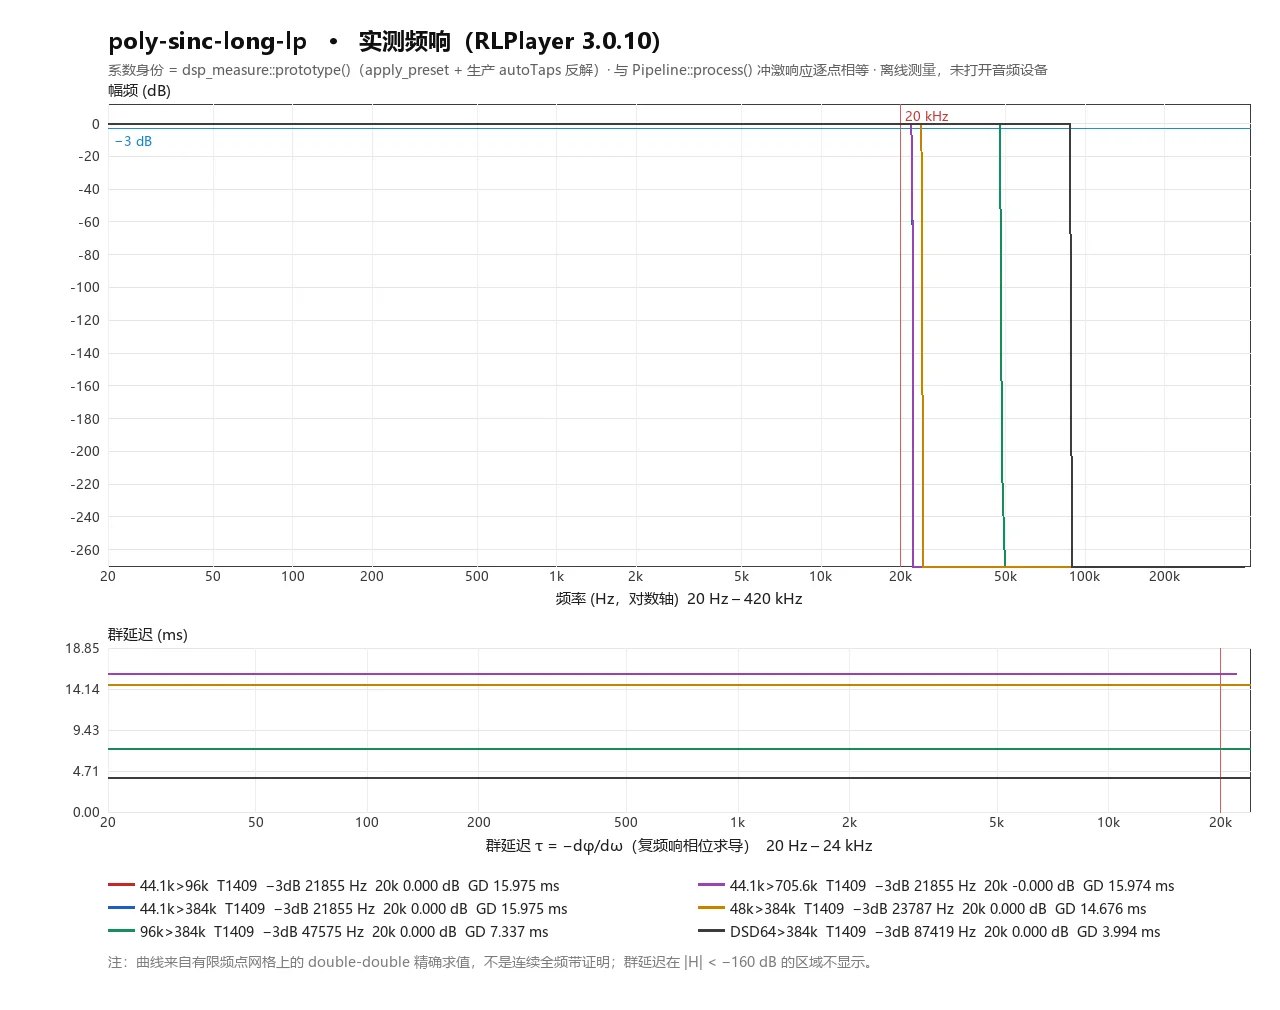
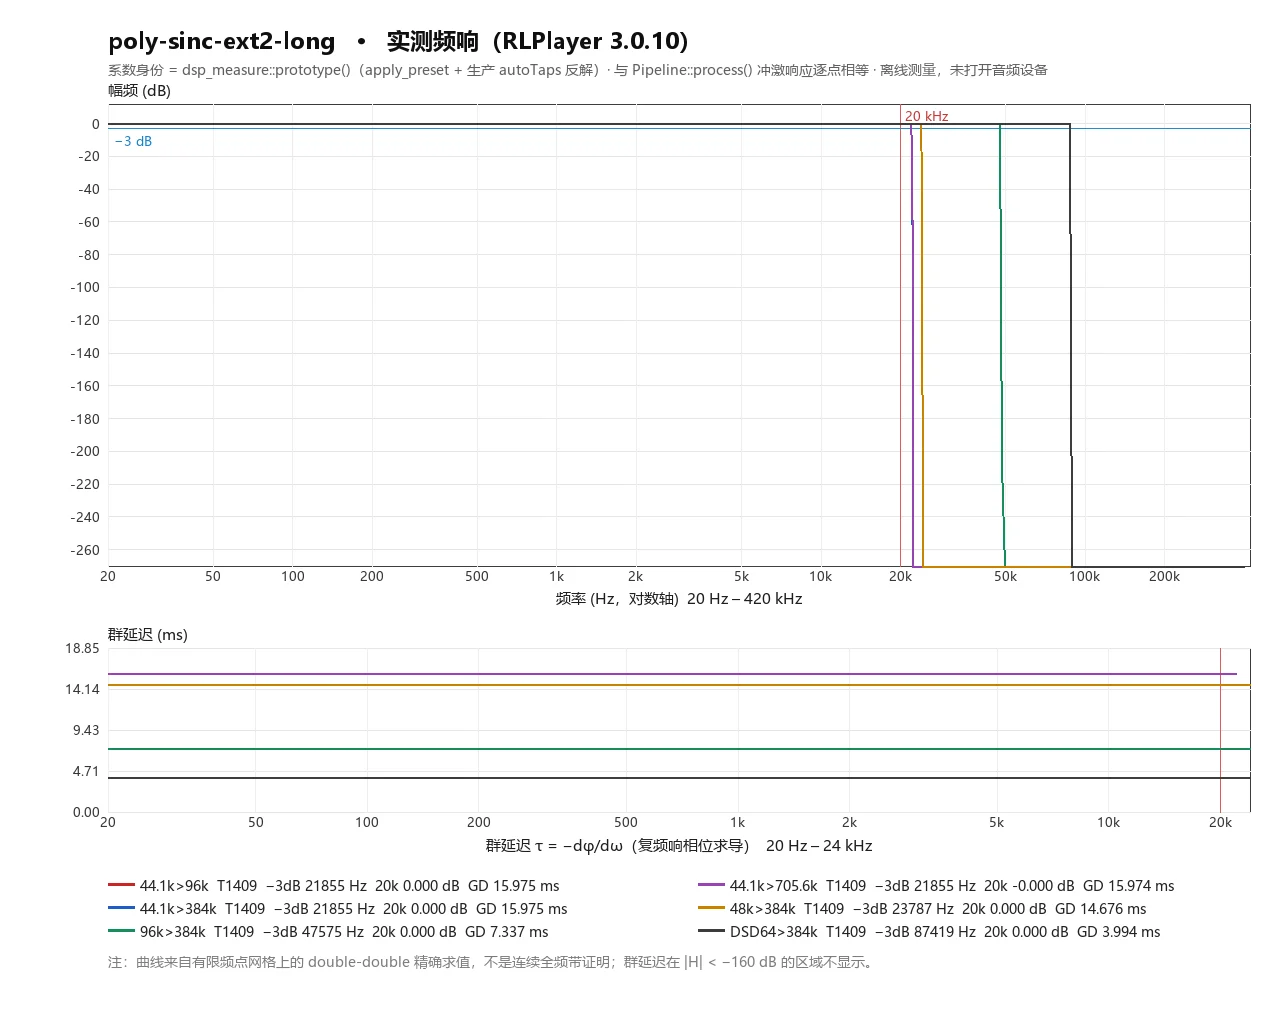
| poly-sinc-long-lp | 1409 | 0.000 | 21855 | -284.83 @ 22391 | 15.975 | OK |
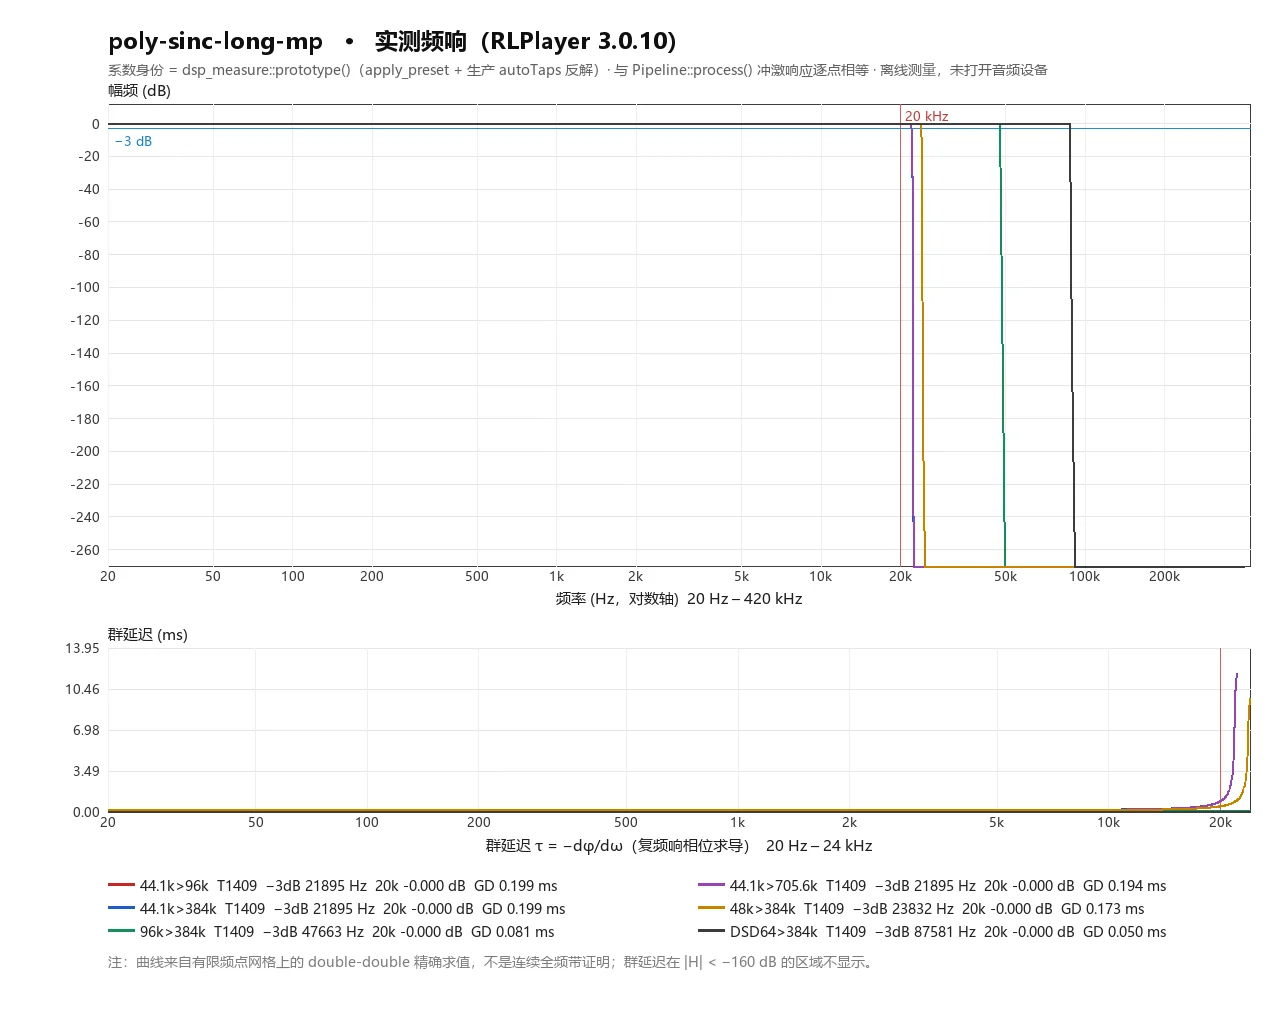
| poly-sinc-long-mp | 1409 | -0.000 | 21895 | -285.56 @ 22396 | 0.199 | OK |
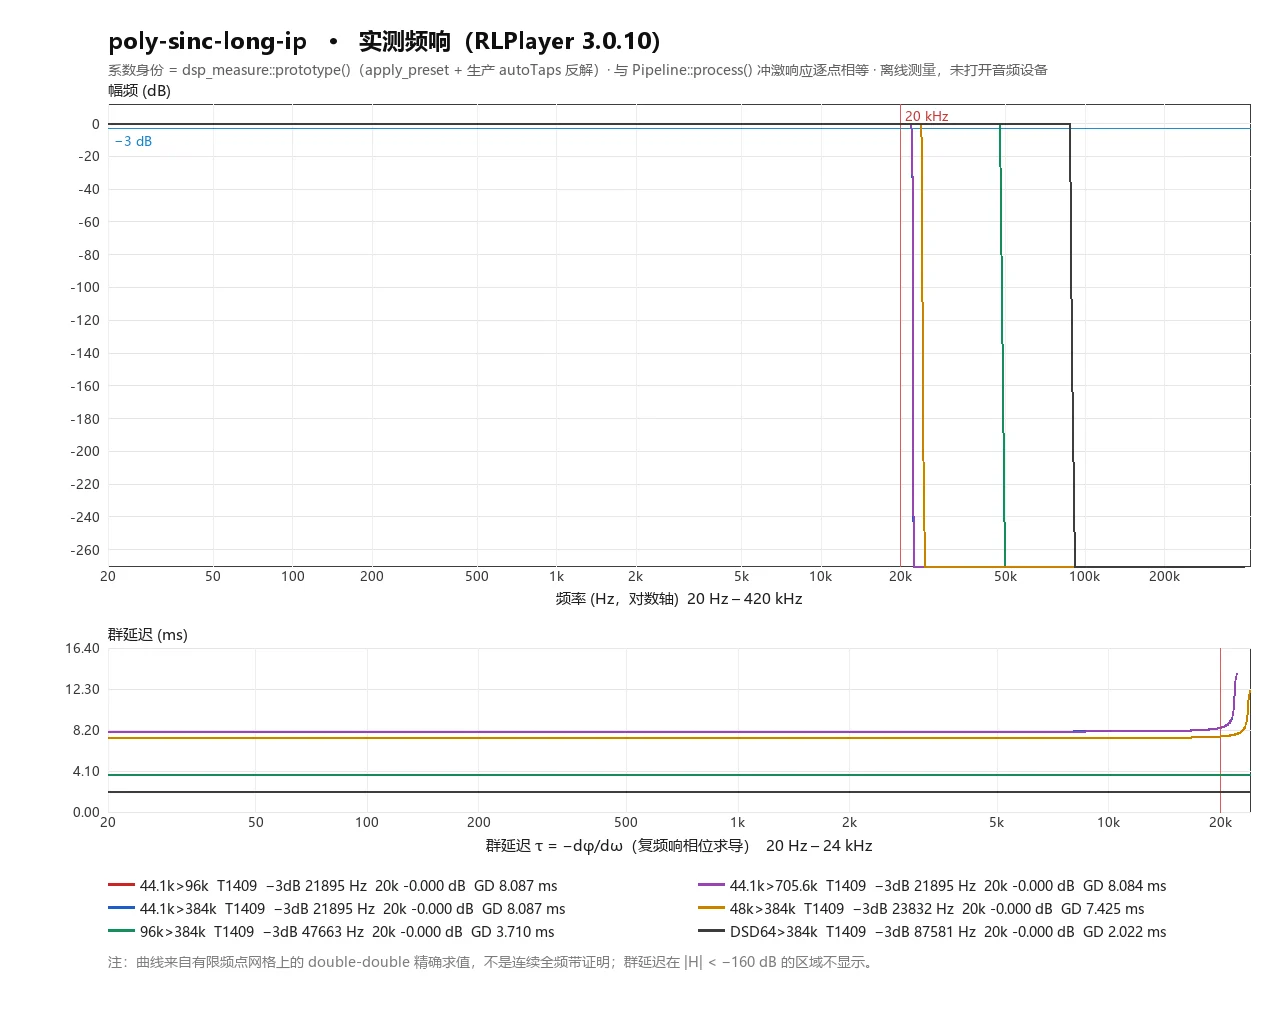
| poly-sinc-long-ip | 1409 | -0.000 | 21895 | -285.56 @ 22396 | 8.087 | OK |
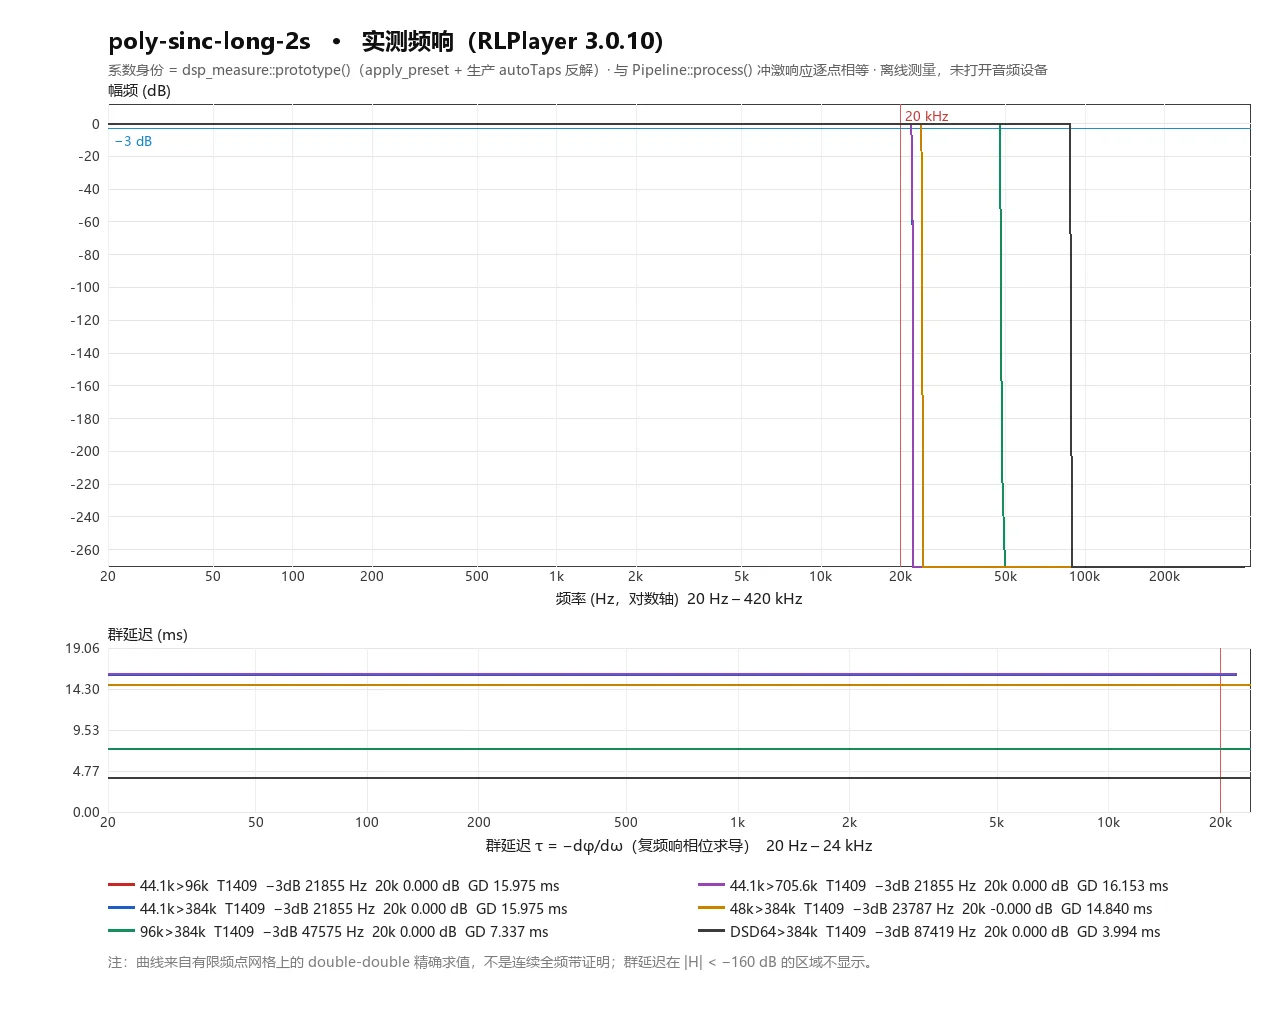
| poly-sinc-long-2s | 1409 | 0.000 | 21855 | -284.83 @ 22391 | 15.975 | OK |
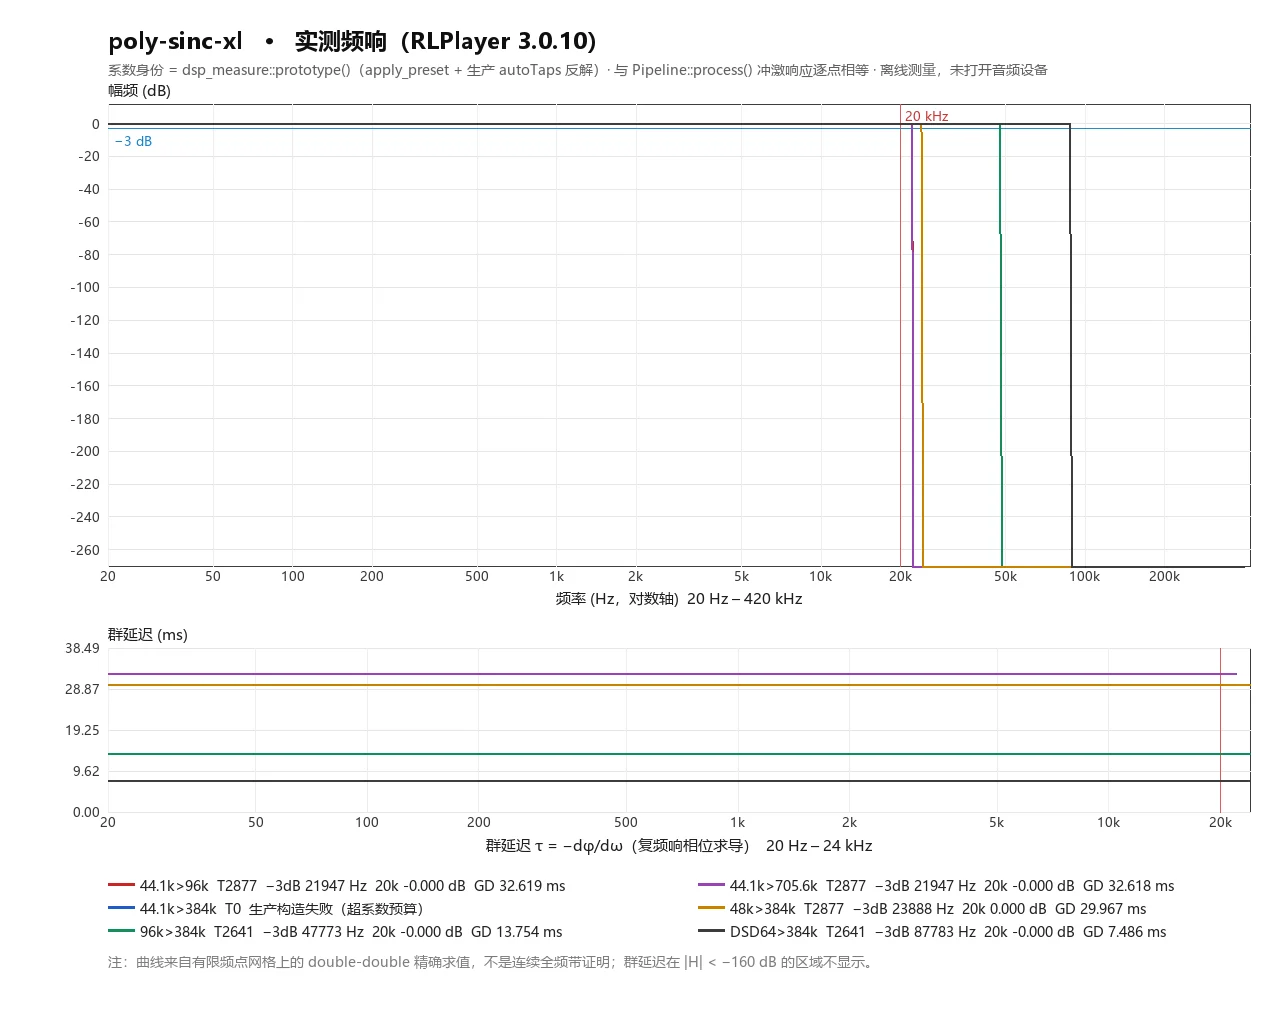
| poly-sinc-xl | — | — | — | — | — | Failed to construct |
| poly-sinc-xla | — | — | — | — | — | Failed to construct |
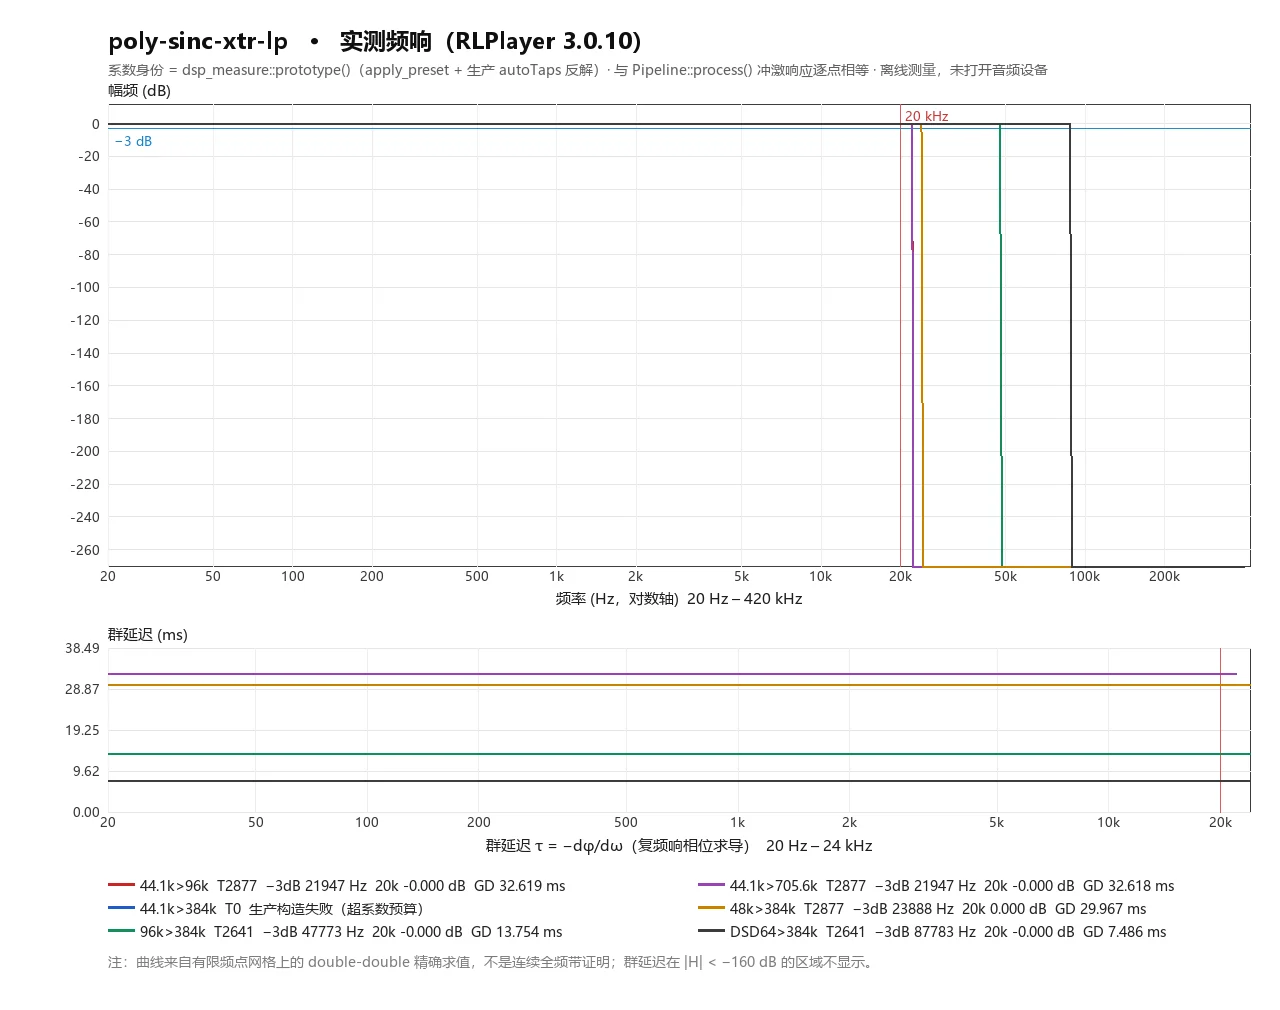
| poly-sinc-xtr | — | — | — | — | — | Failed to construct |
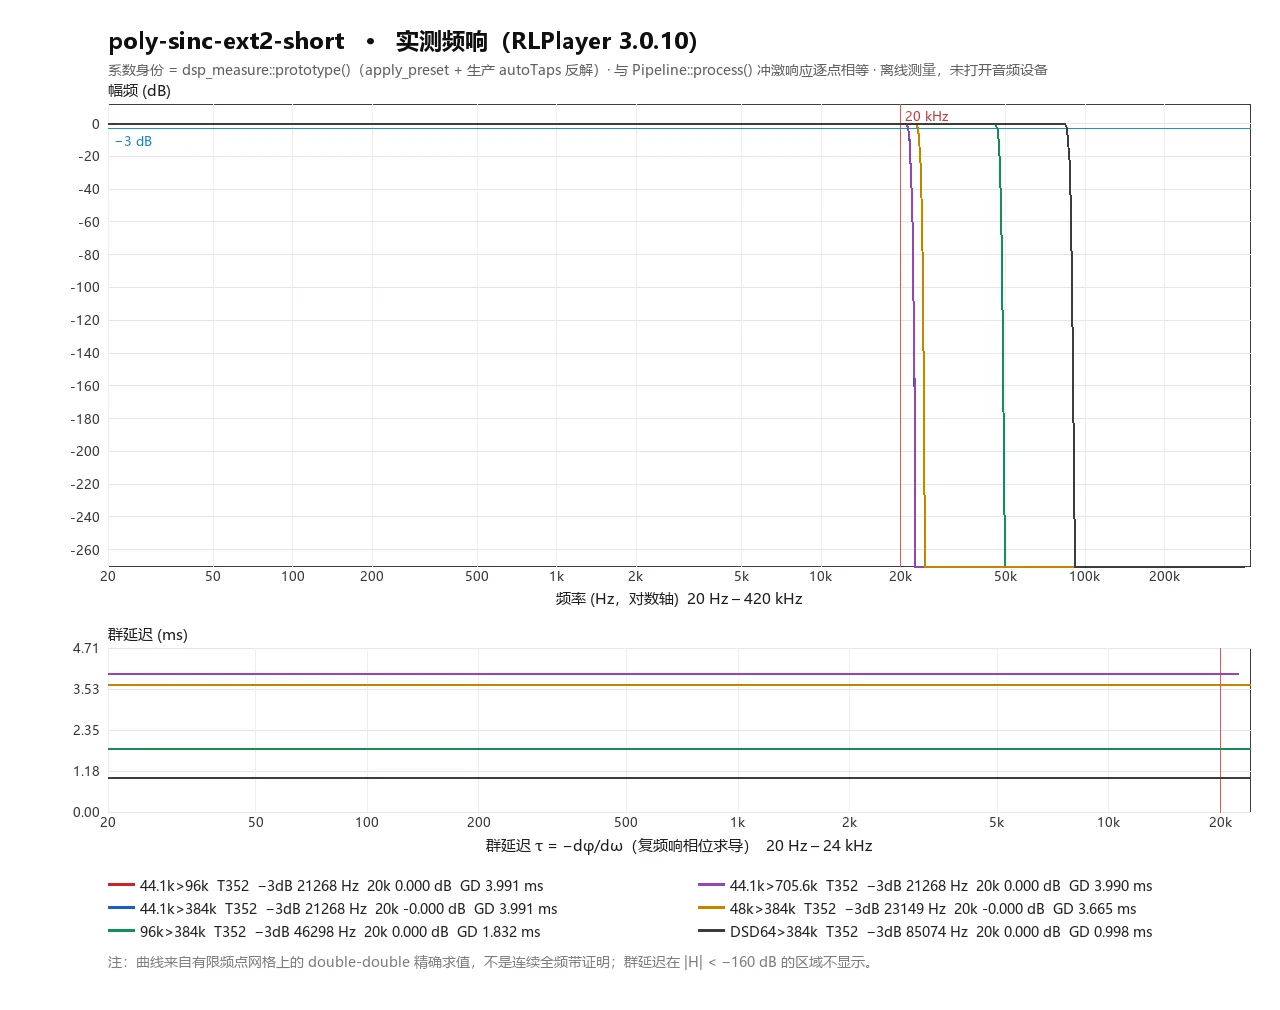
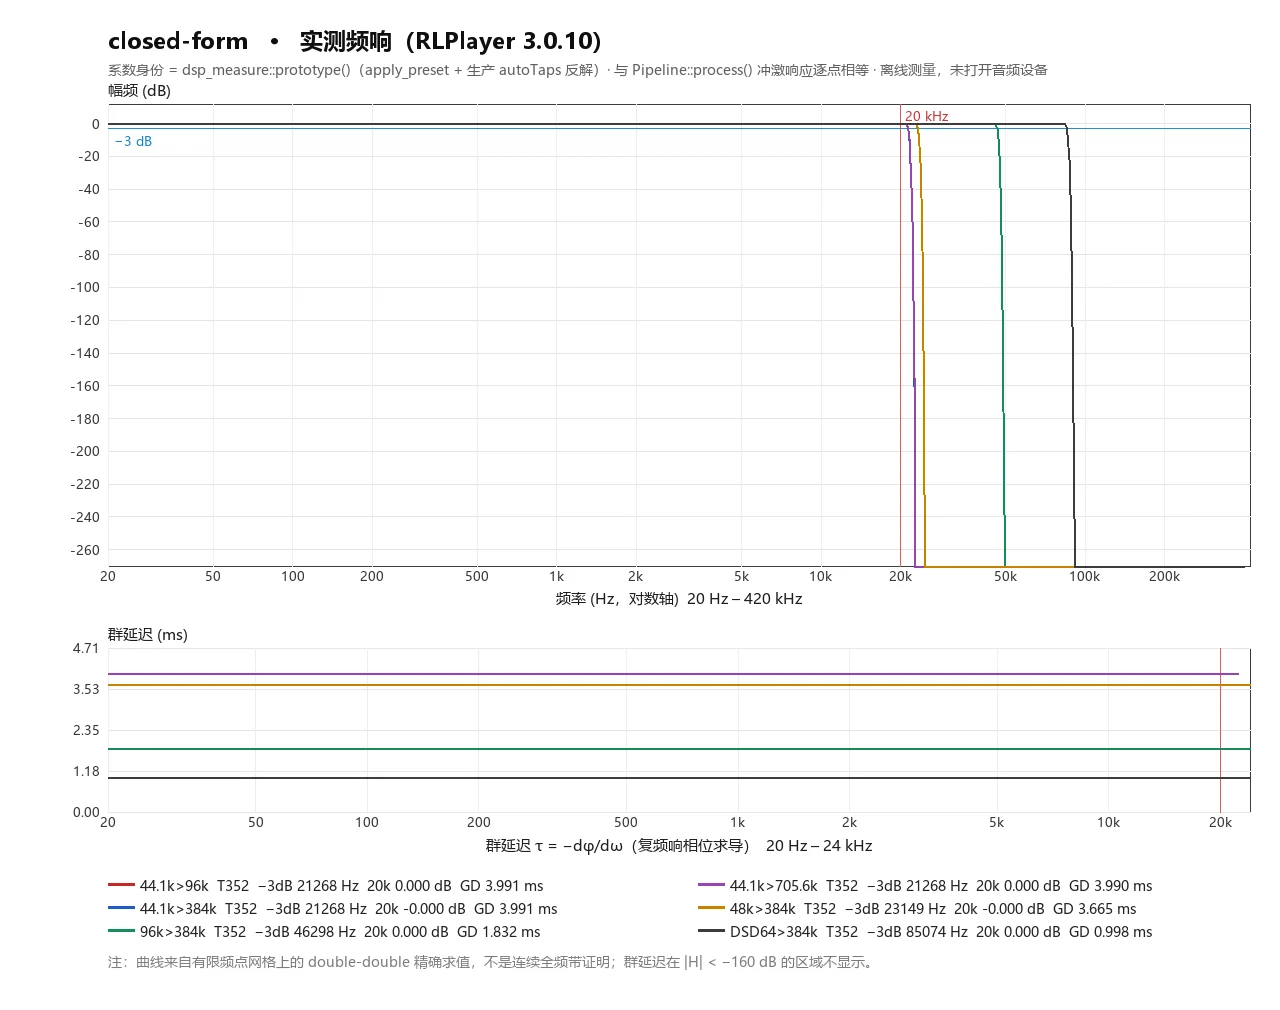
| poly-sinc-ext2-short | 352 | -0.000 | 21268 | -284.75 @ 23417 | 3.991 | OK |
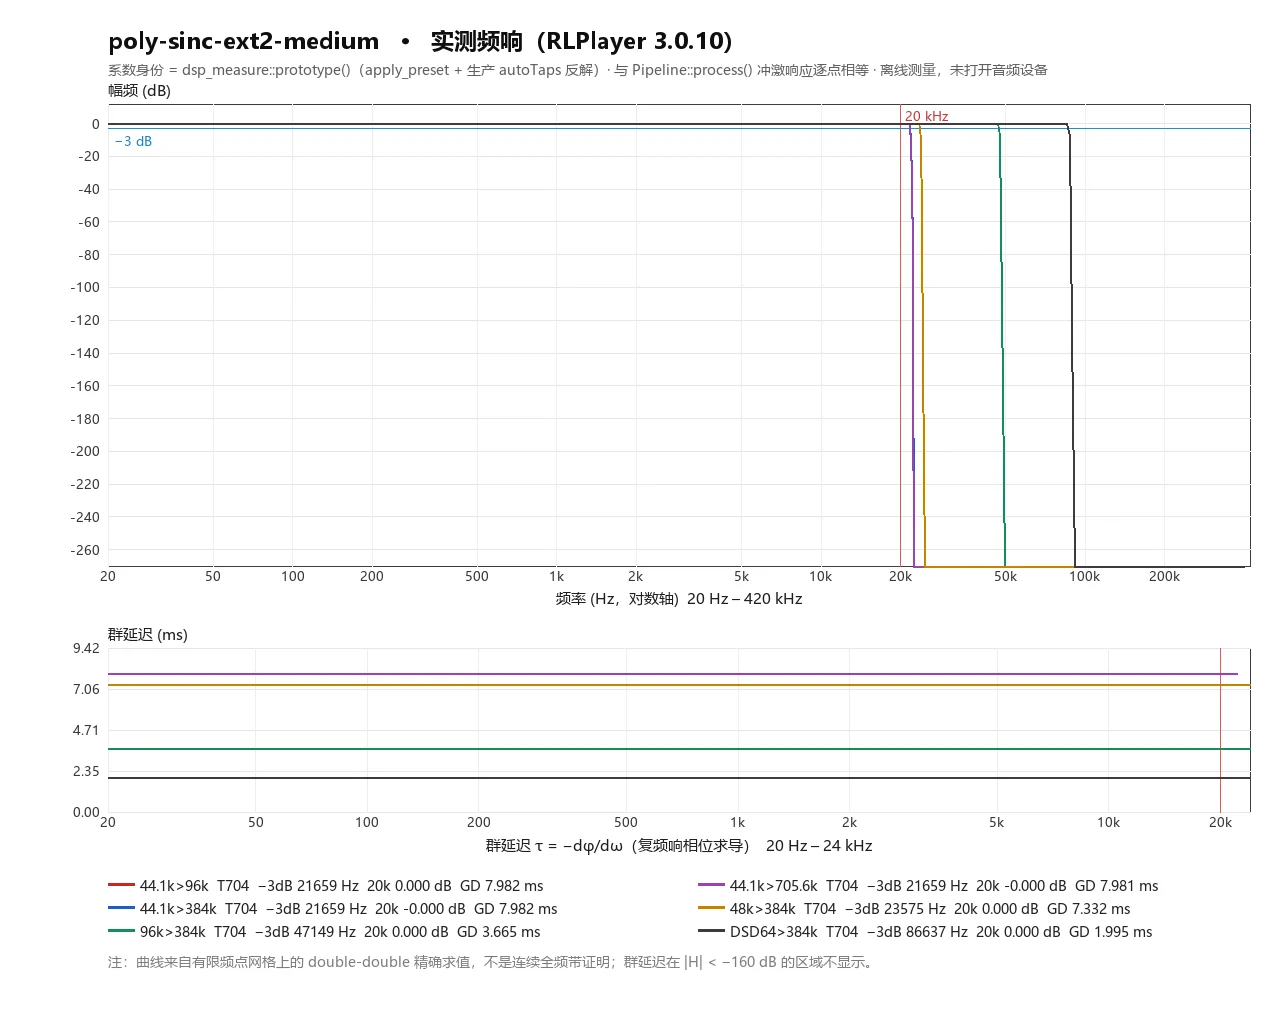
| poly-sinc-ext2-medium | 704 | -0.000 | 21659 | -284.62 @ 22734 | 7.982 | OK |
| poly-sinc-ext2-long | 1409 | 0.000 | 21855 | -284.83 @ 22391 | 15.975 | OK |
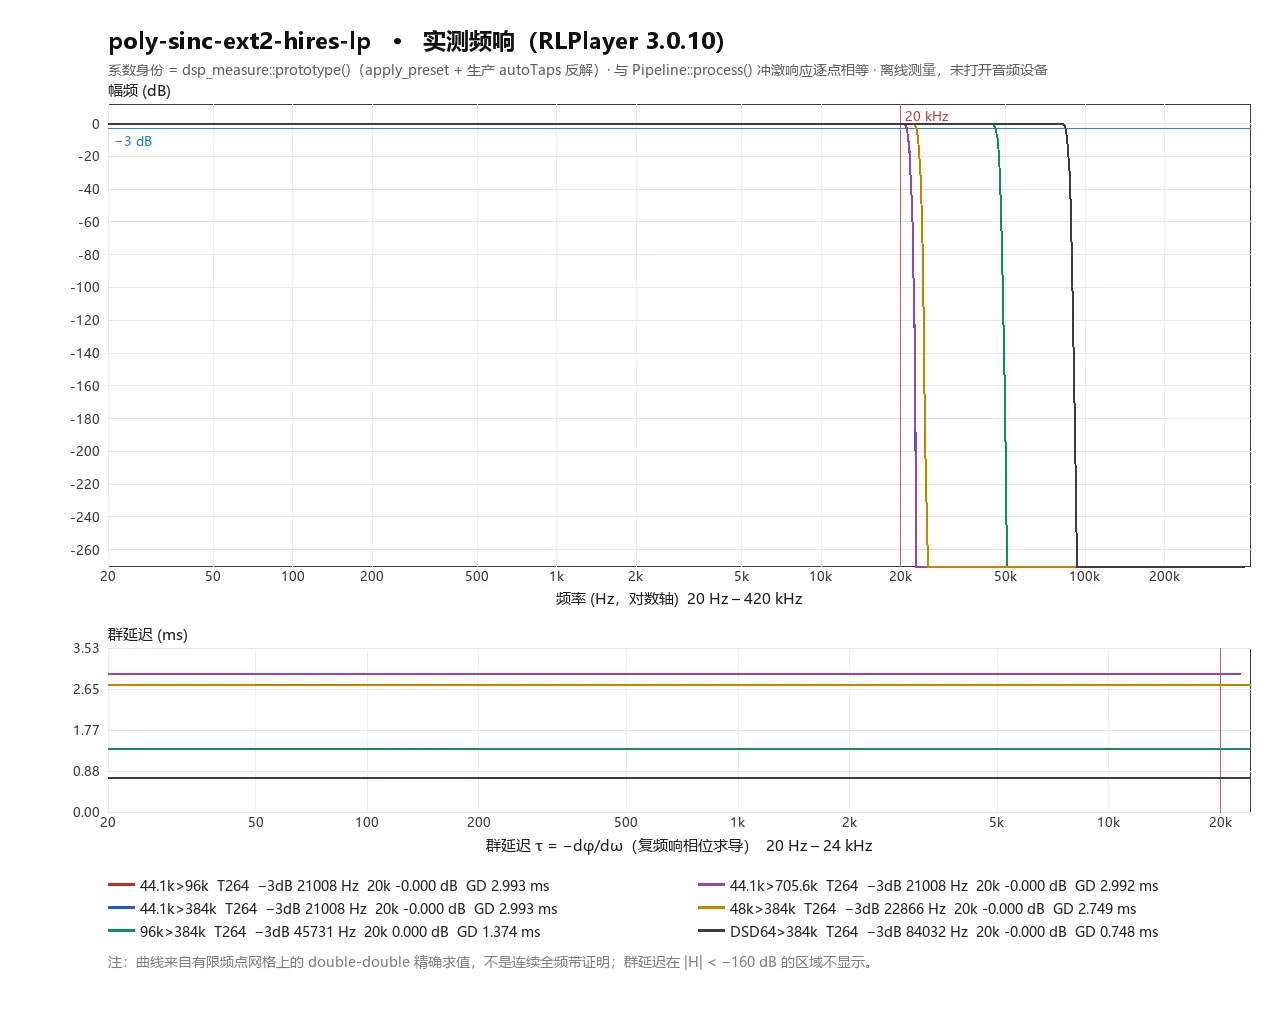
| poly-sinc-ext2-hires-lp | 264 | -0.000 | 21008 | -284.83 @ 23875 | 2.993 | OK |
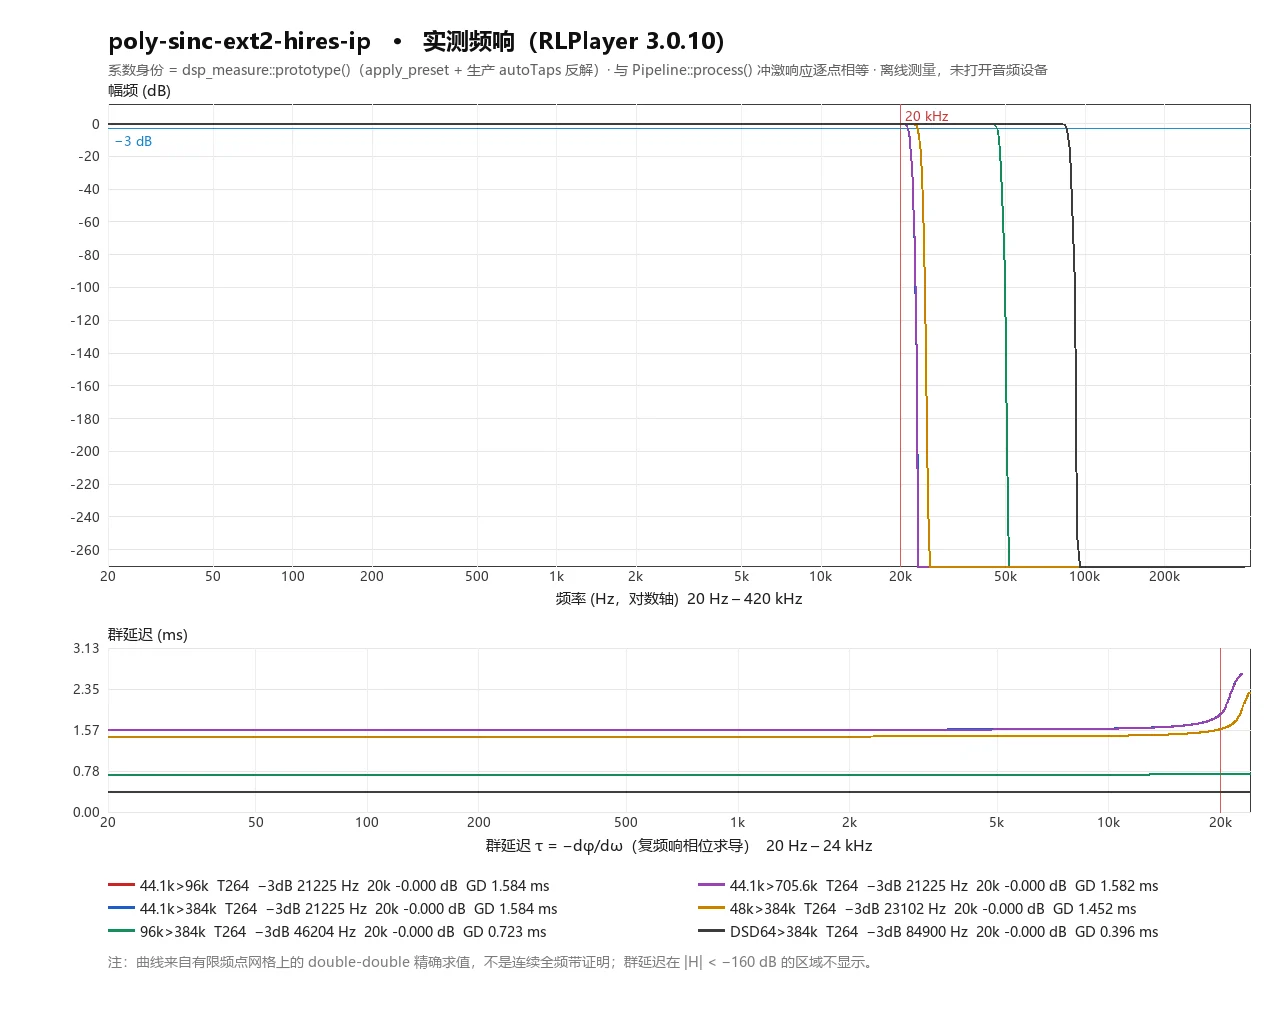
| poly-sinc-ext2-hires-ip | 264 | -0.000 | 21225 | -284.49 @ 23902 | 1.584 | OK |
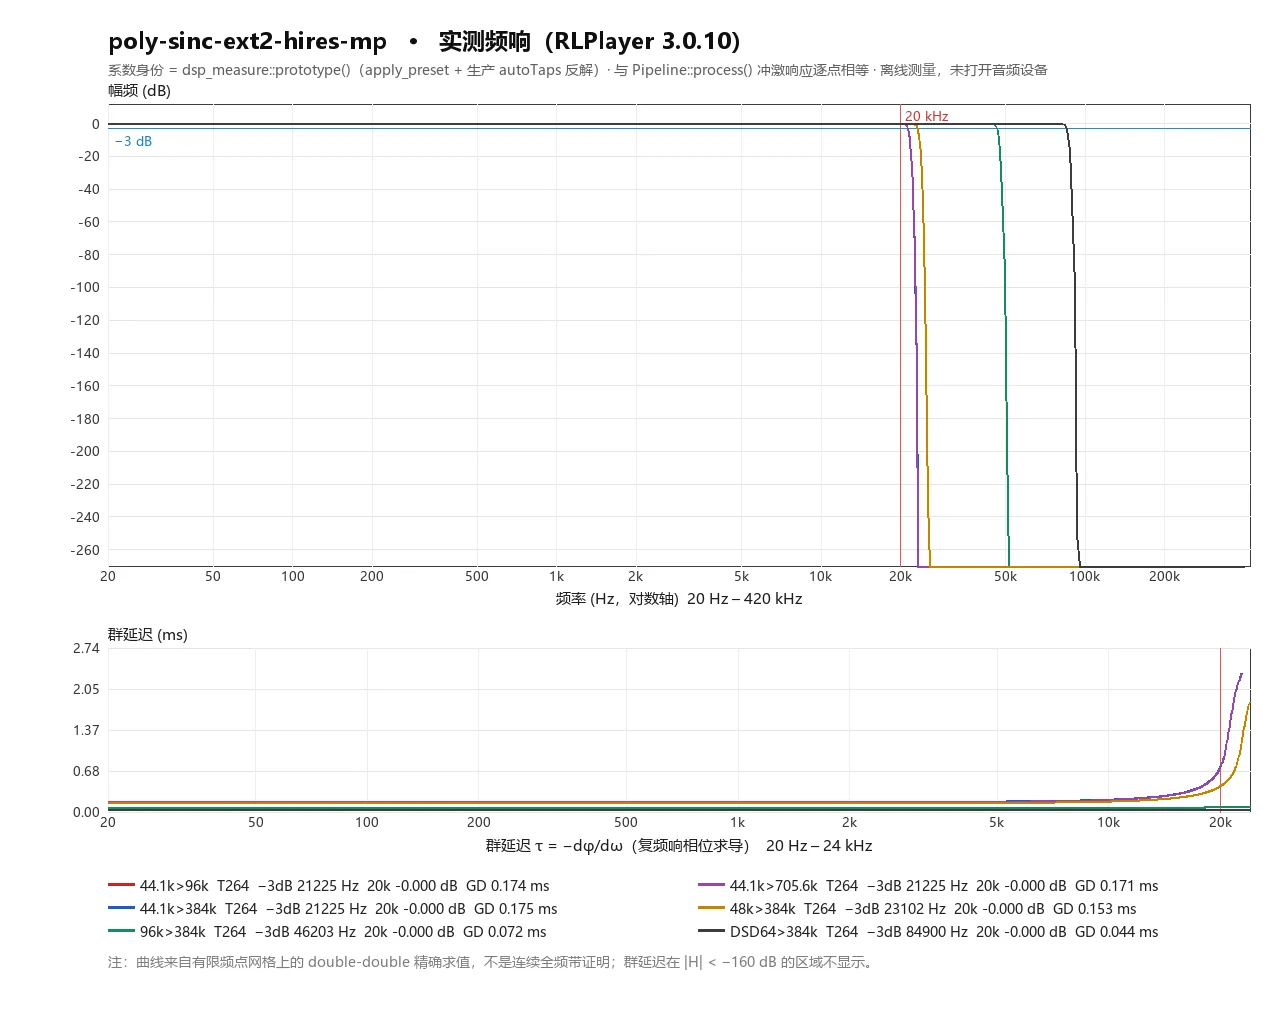
| poly-sinc-ext2-hires-mp | 264 | -0.000 | 21225 | -284.54 @ 23902 | 0.175 | OK |
| poly-sinc-xtr-lp | — | — | — | — | — | Failed to construct |
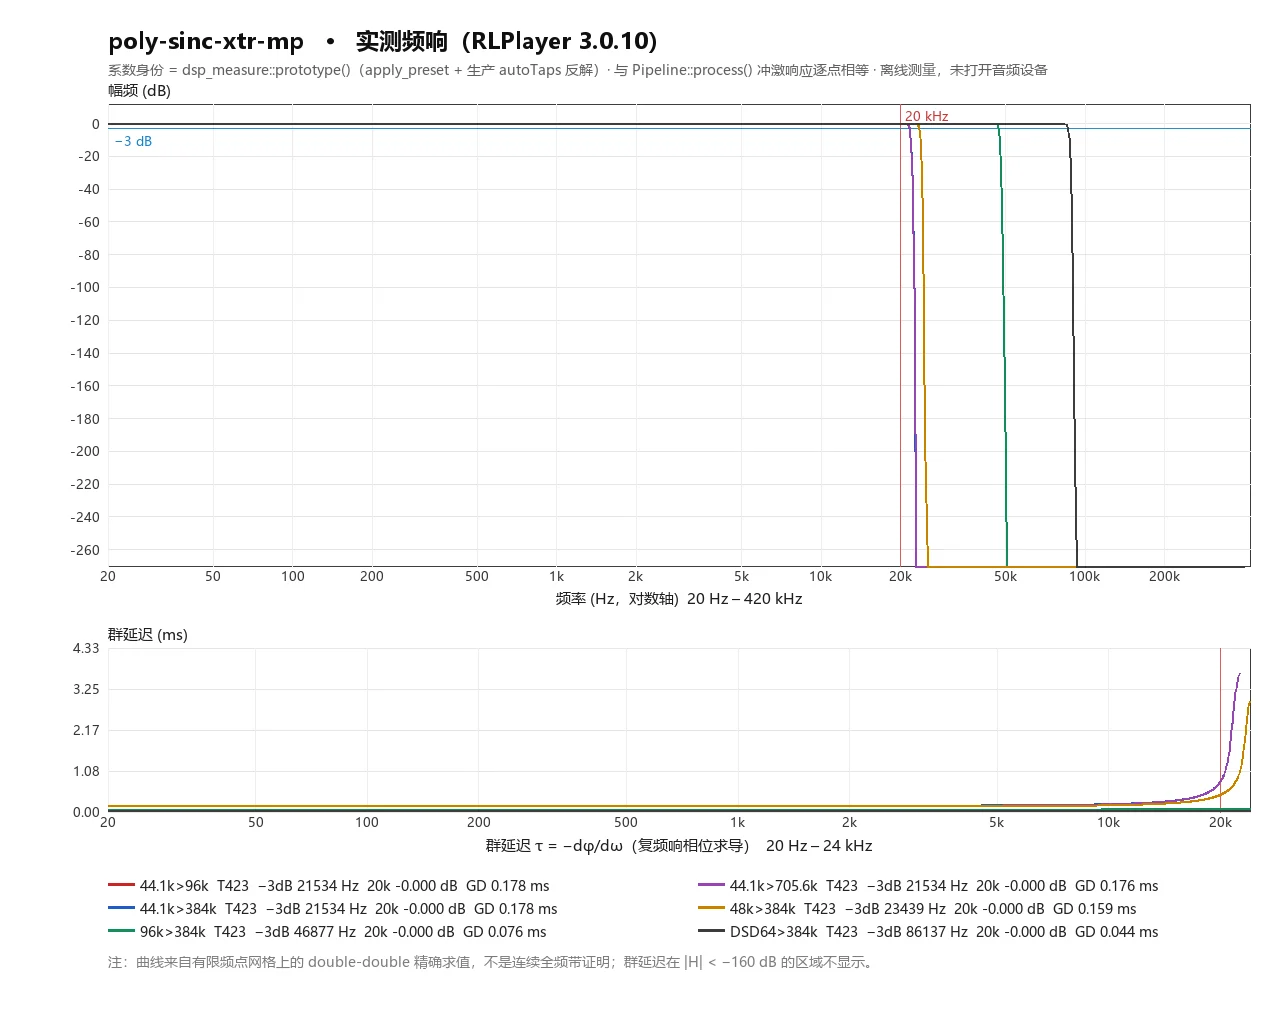
| poly-sinc-xtr-mp | 423 | -0.000 | 21534 | -285.07 @ 23205 | 0.178 | OK |
| poly-sinc-xtr-short-lp | 211 | -0.035 | 20747 | -284.50 @ 24333 | 2.392 | OK |
| poly-sinc-xtr-short-mp | 211 | -0.008 | 21019 | -284.85 @ 24366 | 0.170 | OK |
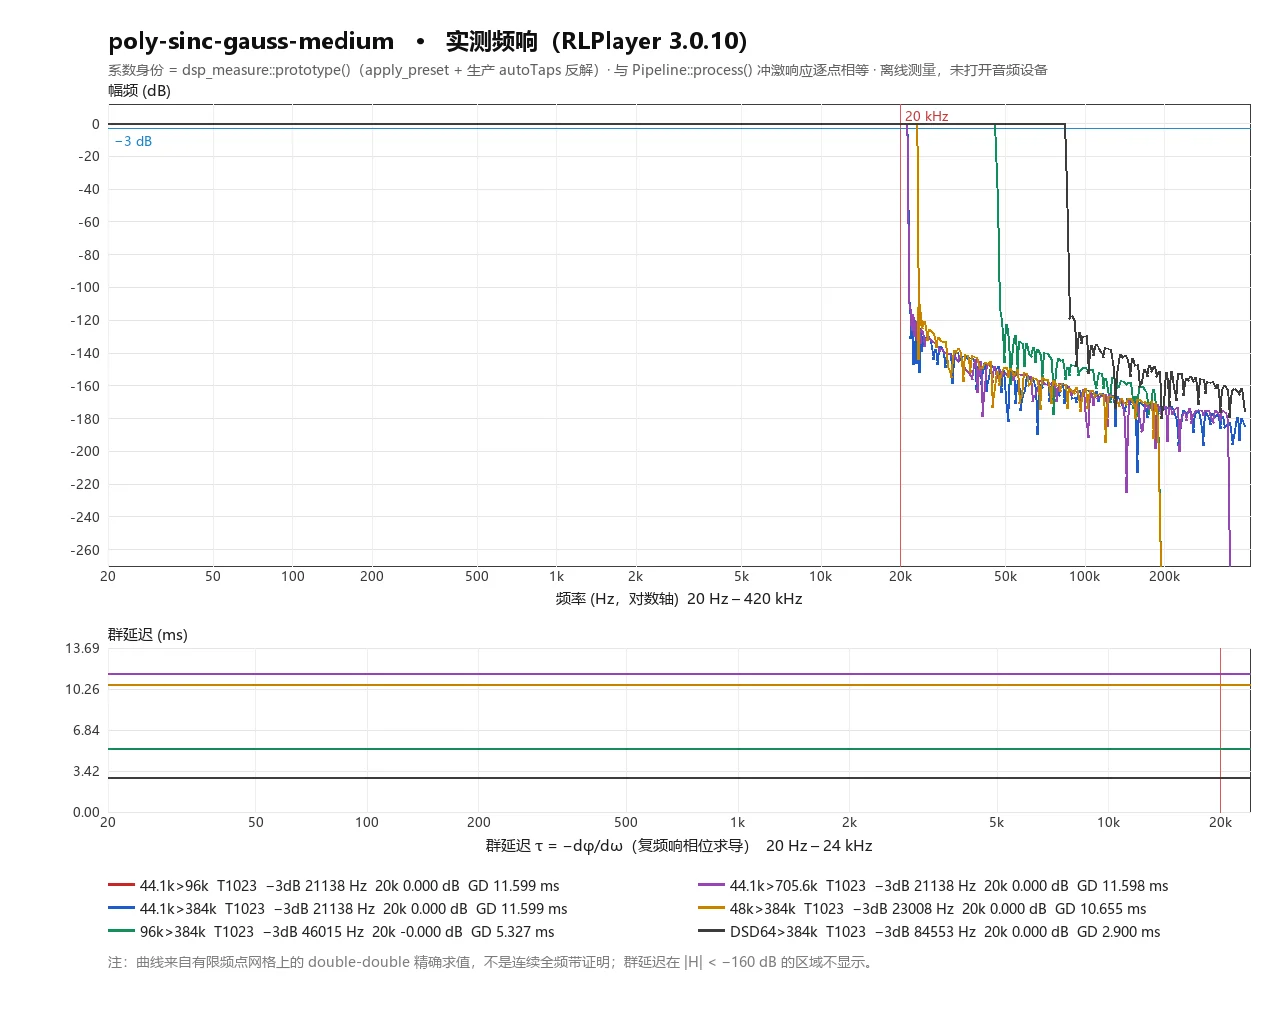
| poly-sinc-gauss-medium | 1023 | 0.000 | 21138 | -125.70 @ 23929 | 11.599 | OK |
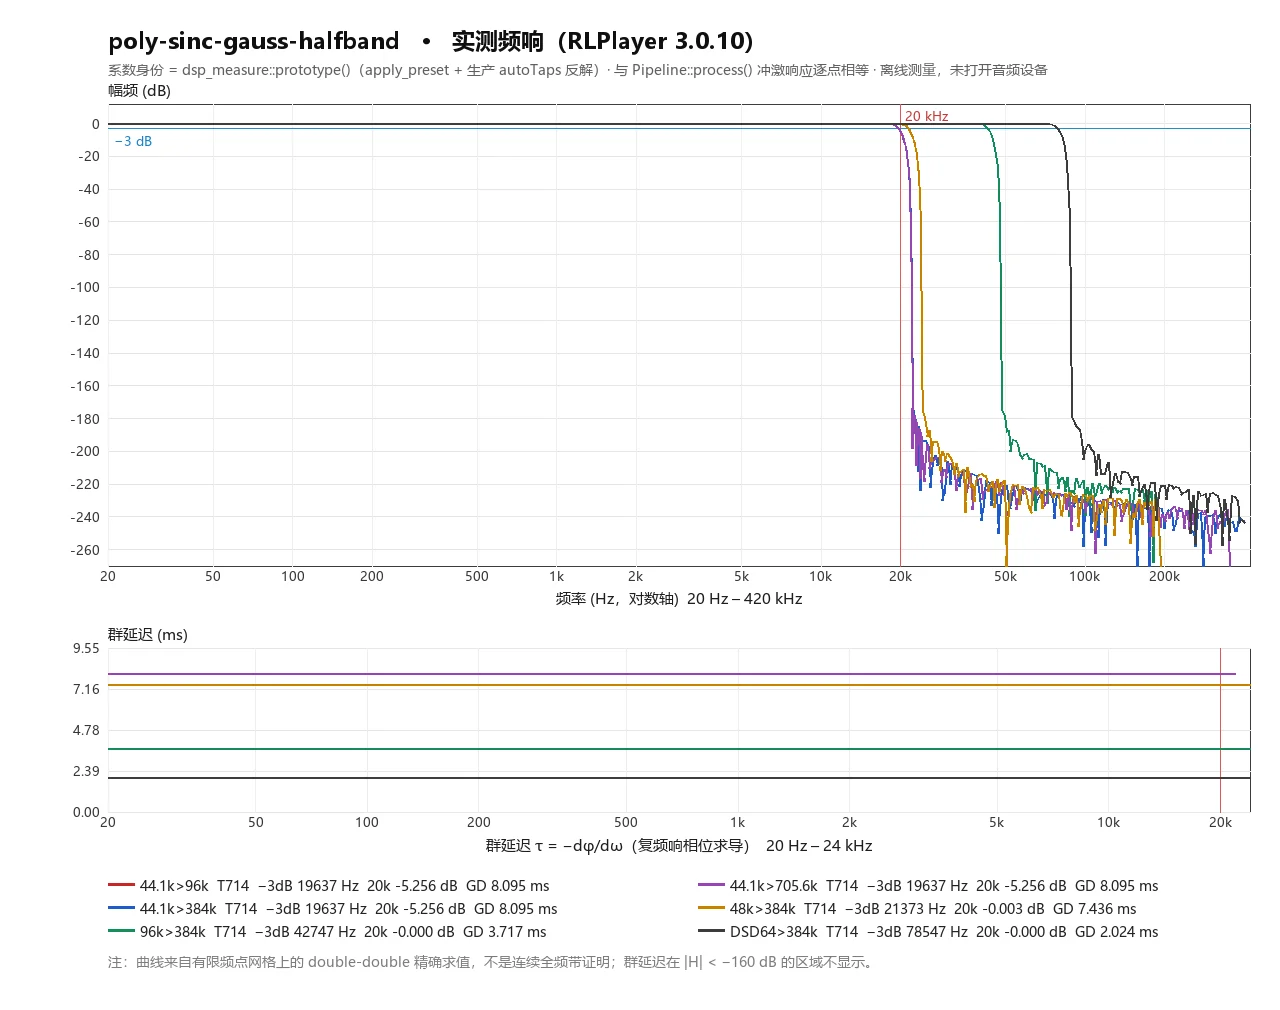
| poly-sinc-gauss-halfband | 714 | -5.256 | 19637 | -196.02 @ 25700 | 8.095 | OK |
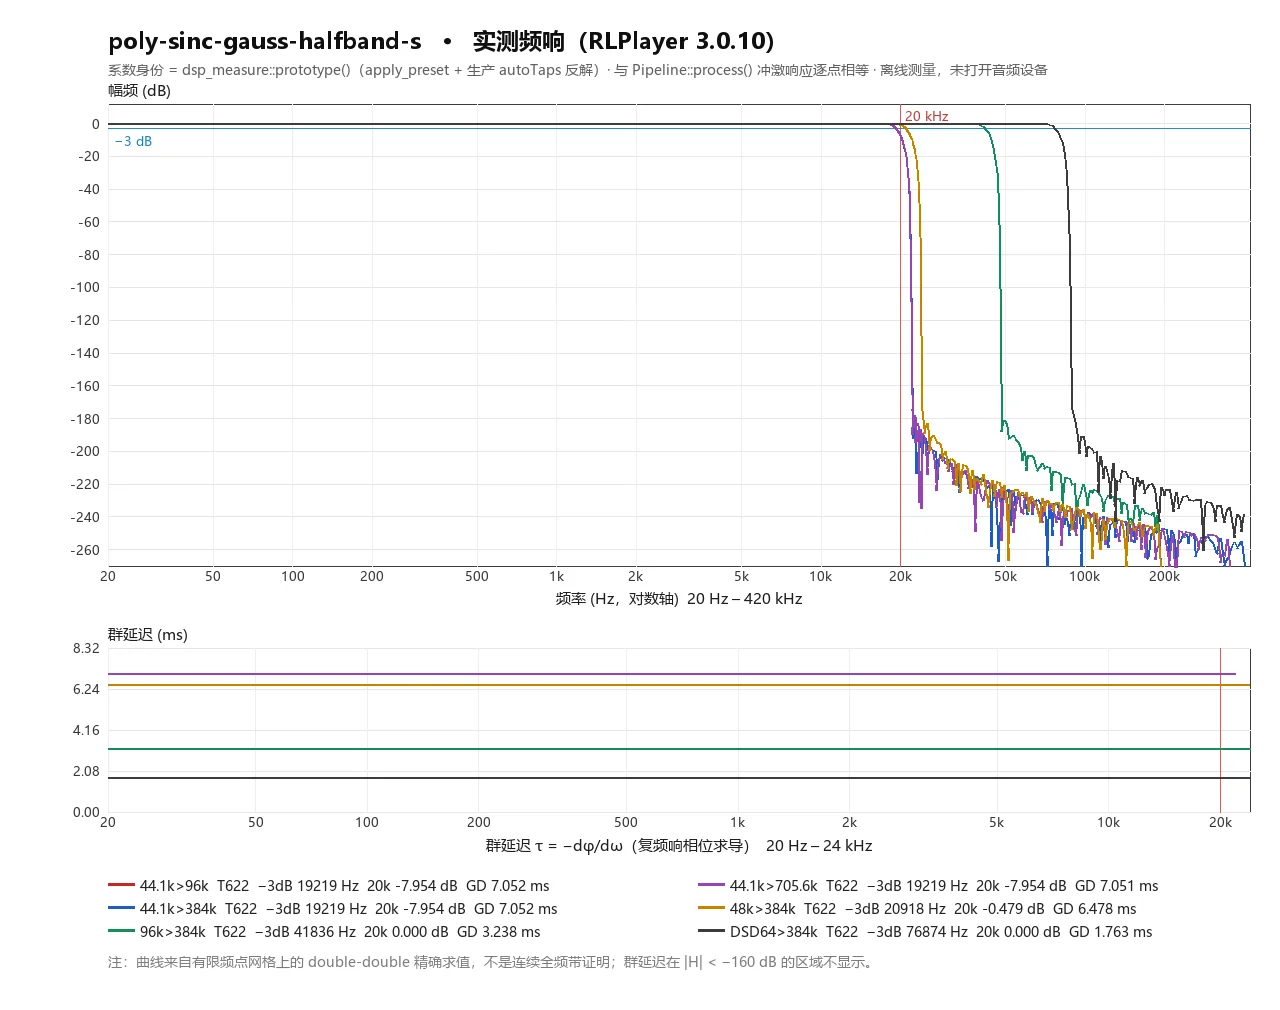
| poly-sinc-gauss-halfband-s | 622 | -7.954 | 19219 | -196.80 @ 26382 | 7.052 | OK |
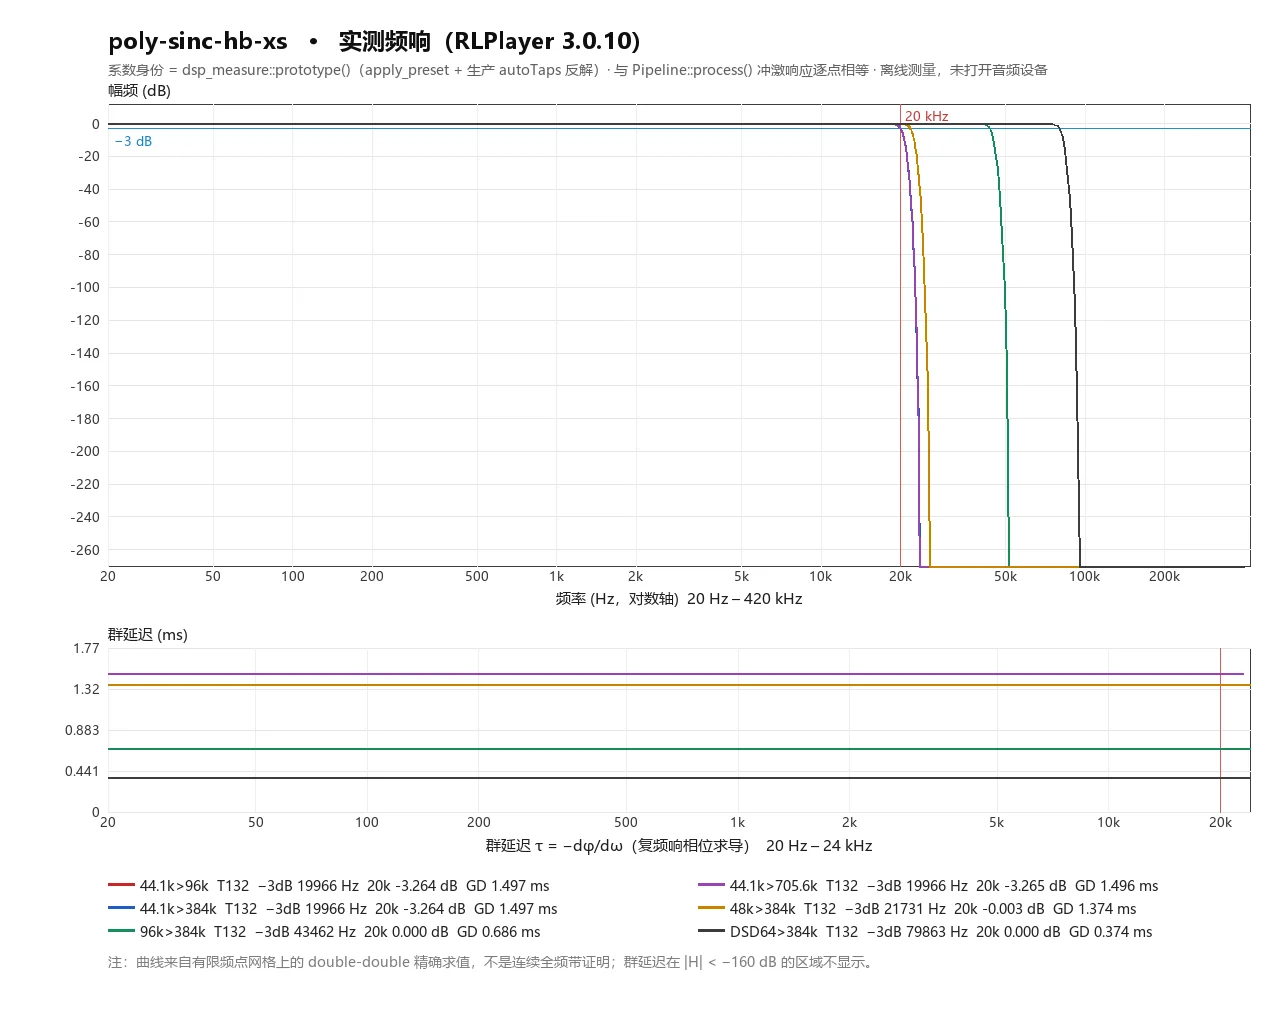
| poly-sinc-hb-xs | 132 | -3.264 | 19966 | -285.48 @ 25705 | 1.497 | OK |
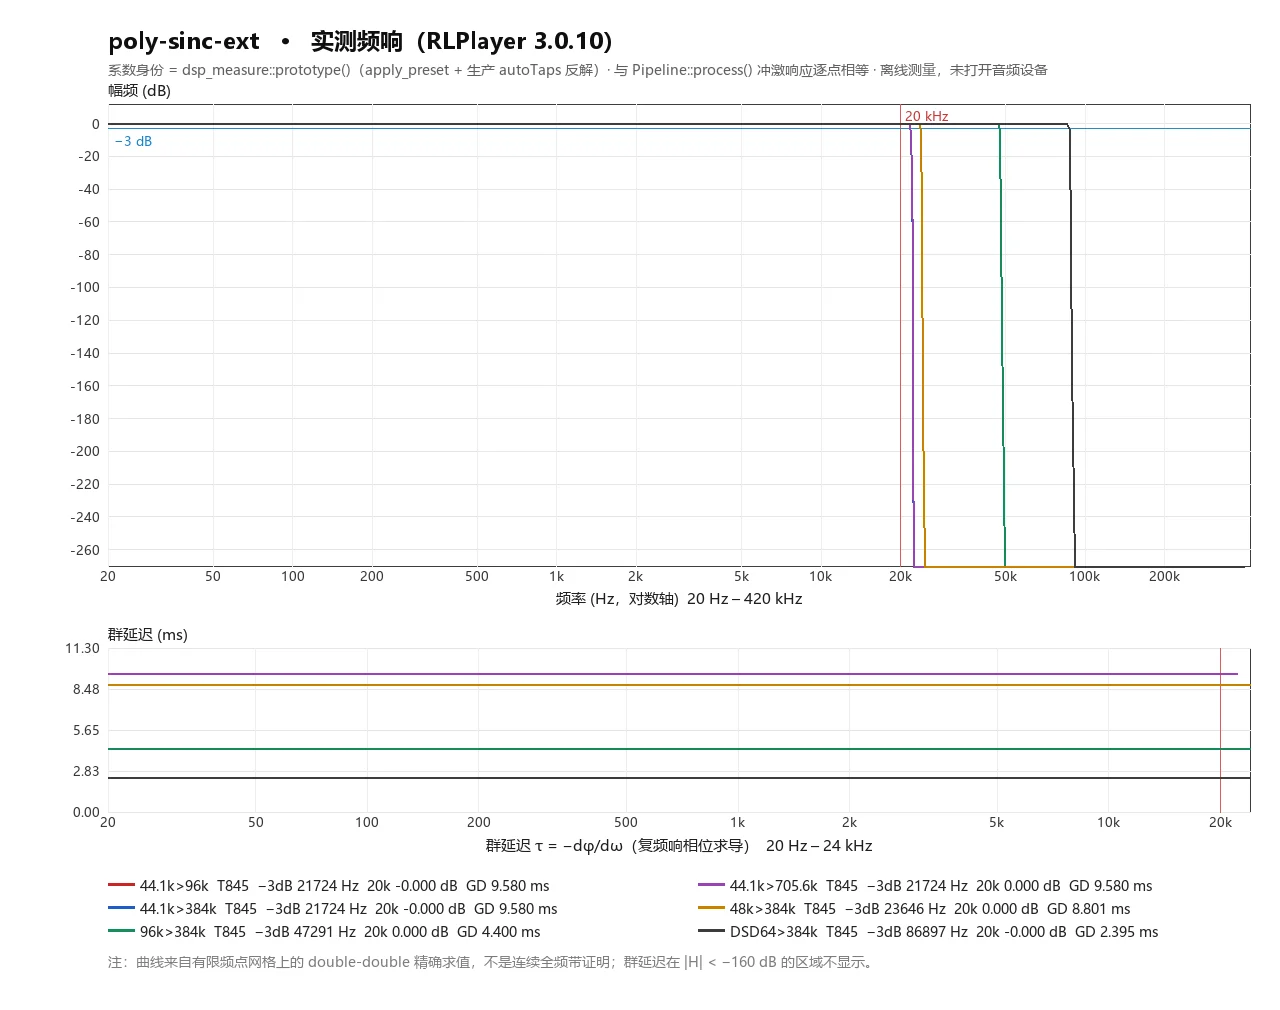
| poly-sinc-ext | 845 | -0.000 | 21724 | -284.81 @ 22620 | 9.580 | OK |
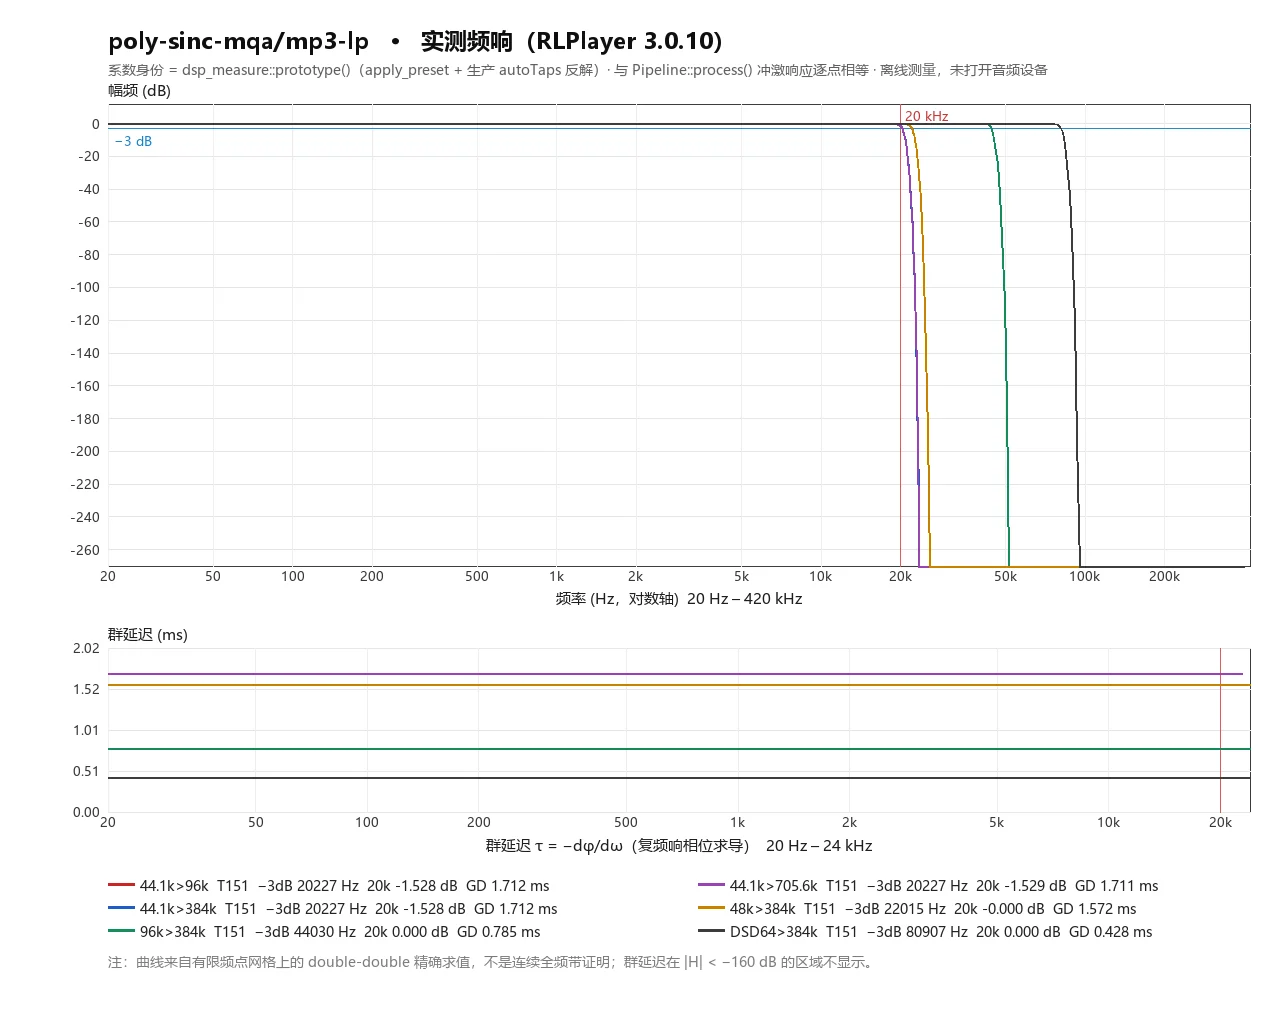
| poly-sinc-mqa/mp3-lp | 151 | -1.528 | 20227 | -284.30 @ 25234 | 1.712 | OK |
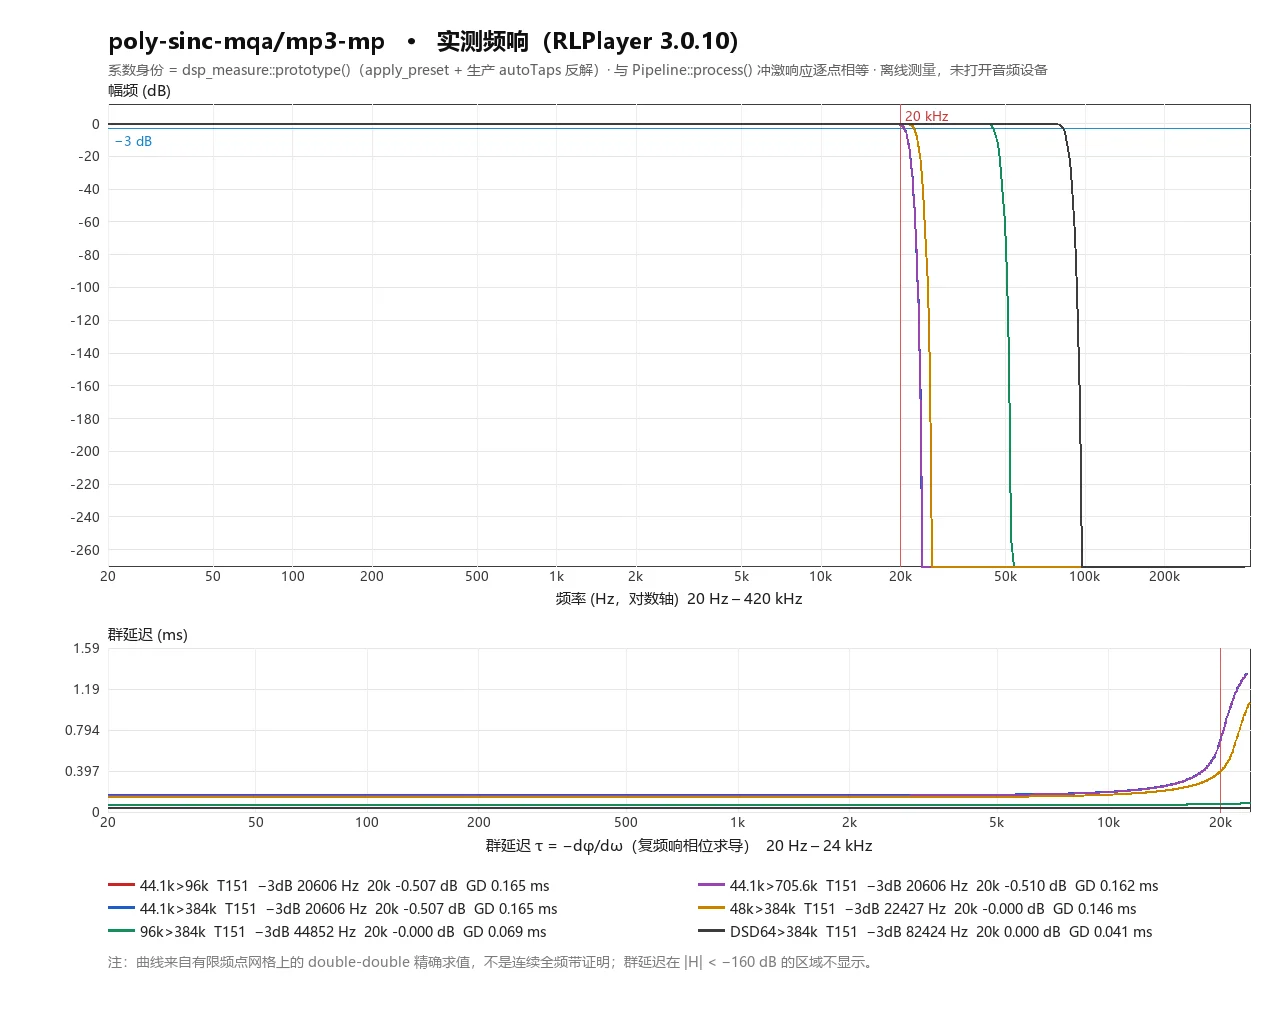
| poly-sinc-mqa/mp3-mp | 151 | -0.507 | 20606 | -284.83 @ 25288 | 0.165 | OK |
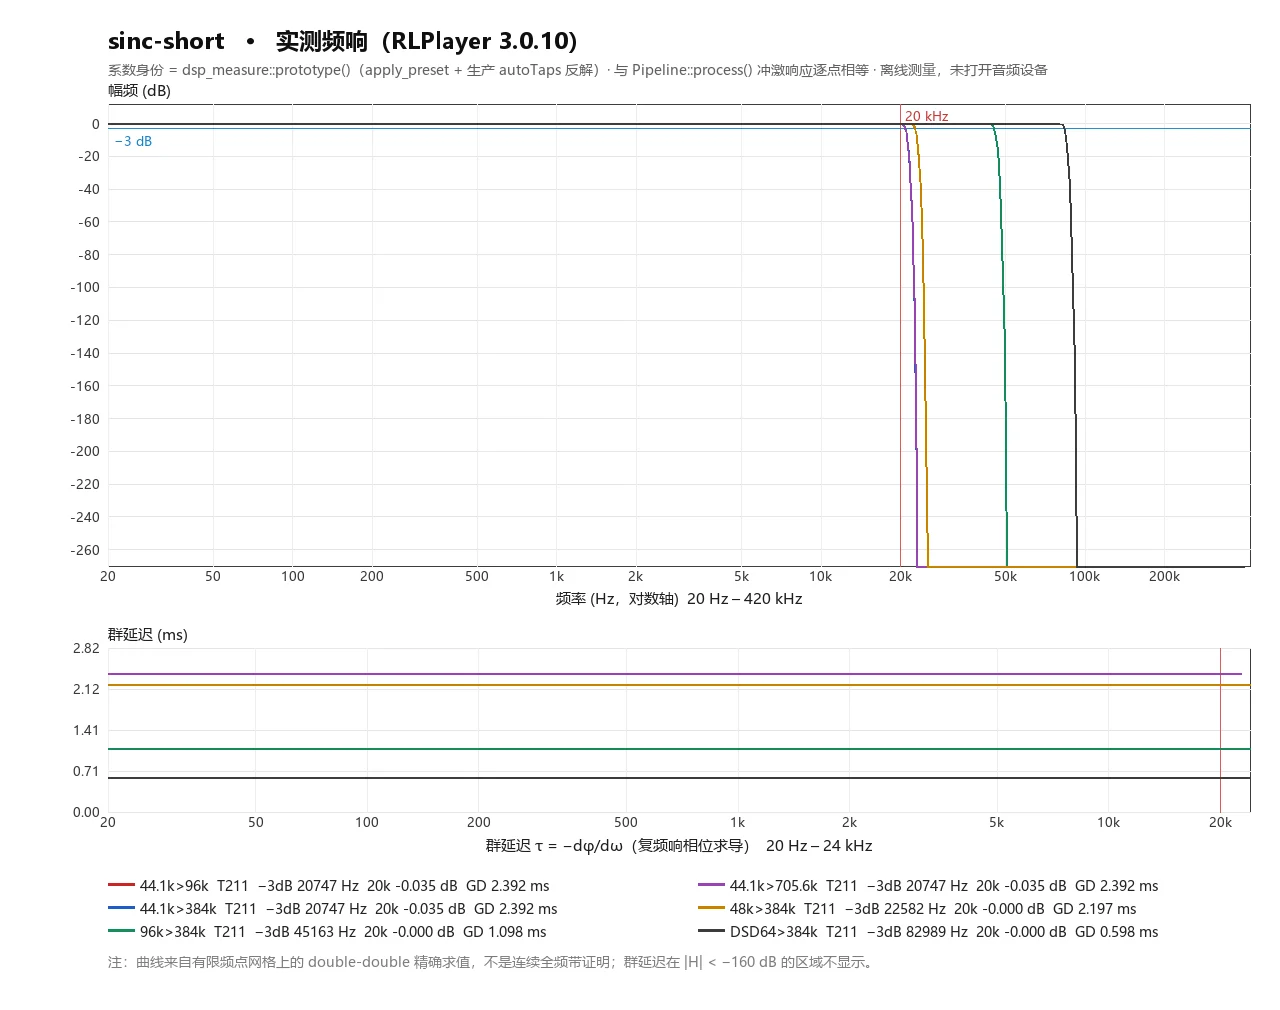
| sinc-short | 211 | -0.035 | 20747 | -284.50 @ 24333 | 2.392 | OK |
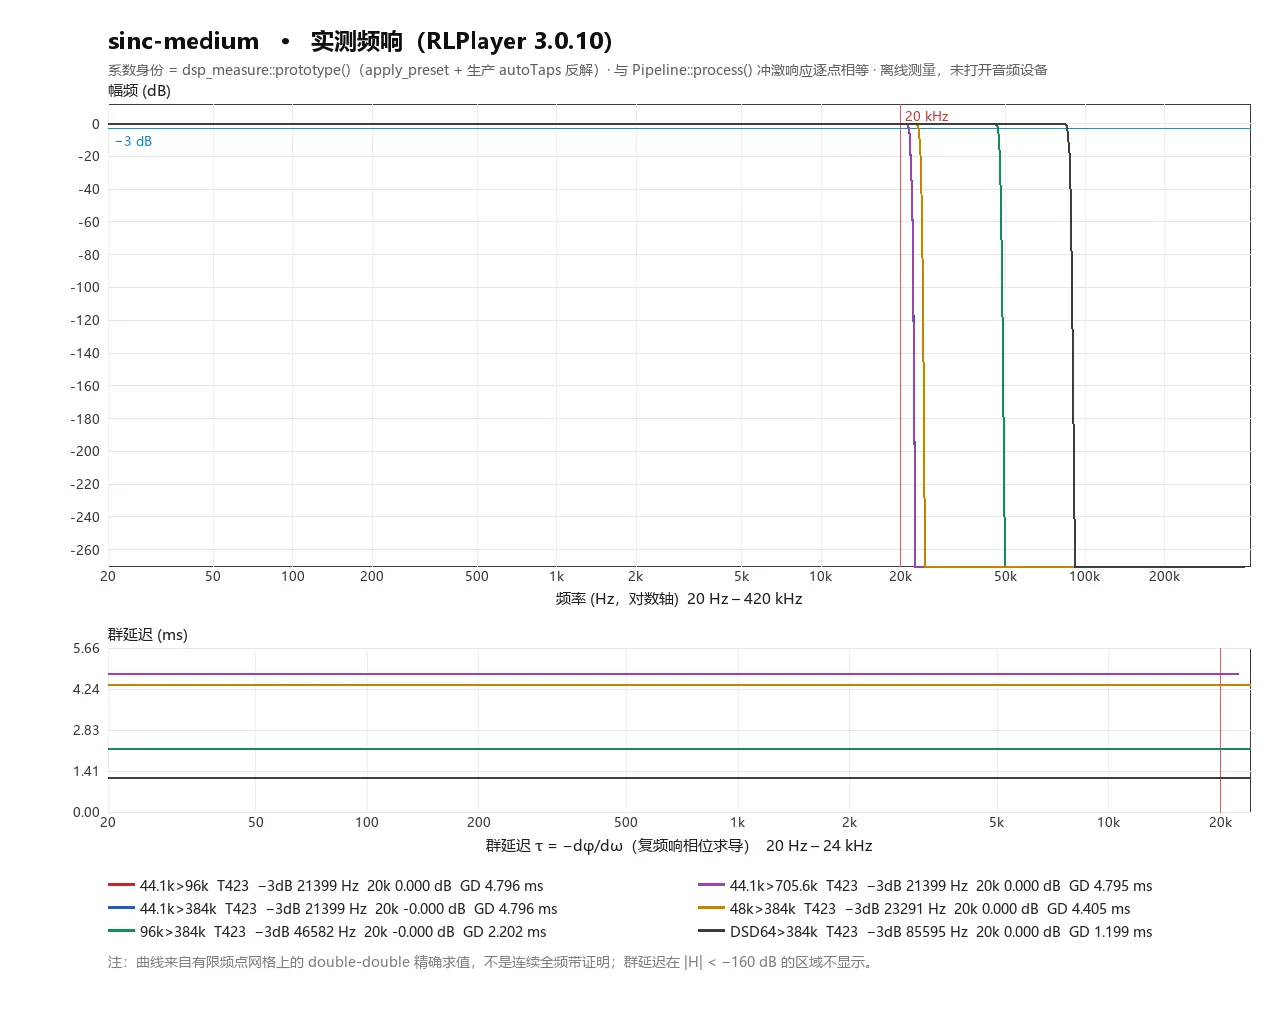
| sinc-medium | 423 | -0.000 | 21399 | -284.90 @ 23185 | 4.796 | OK |
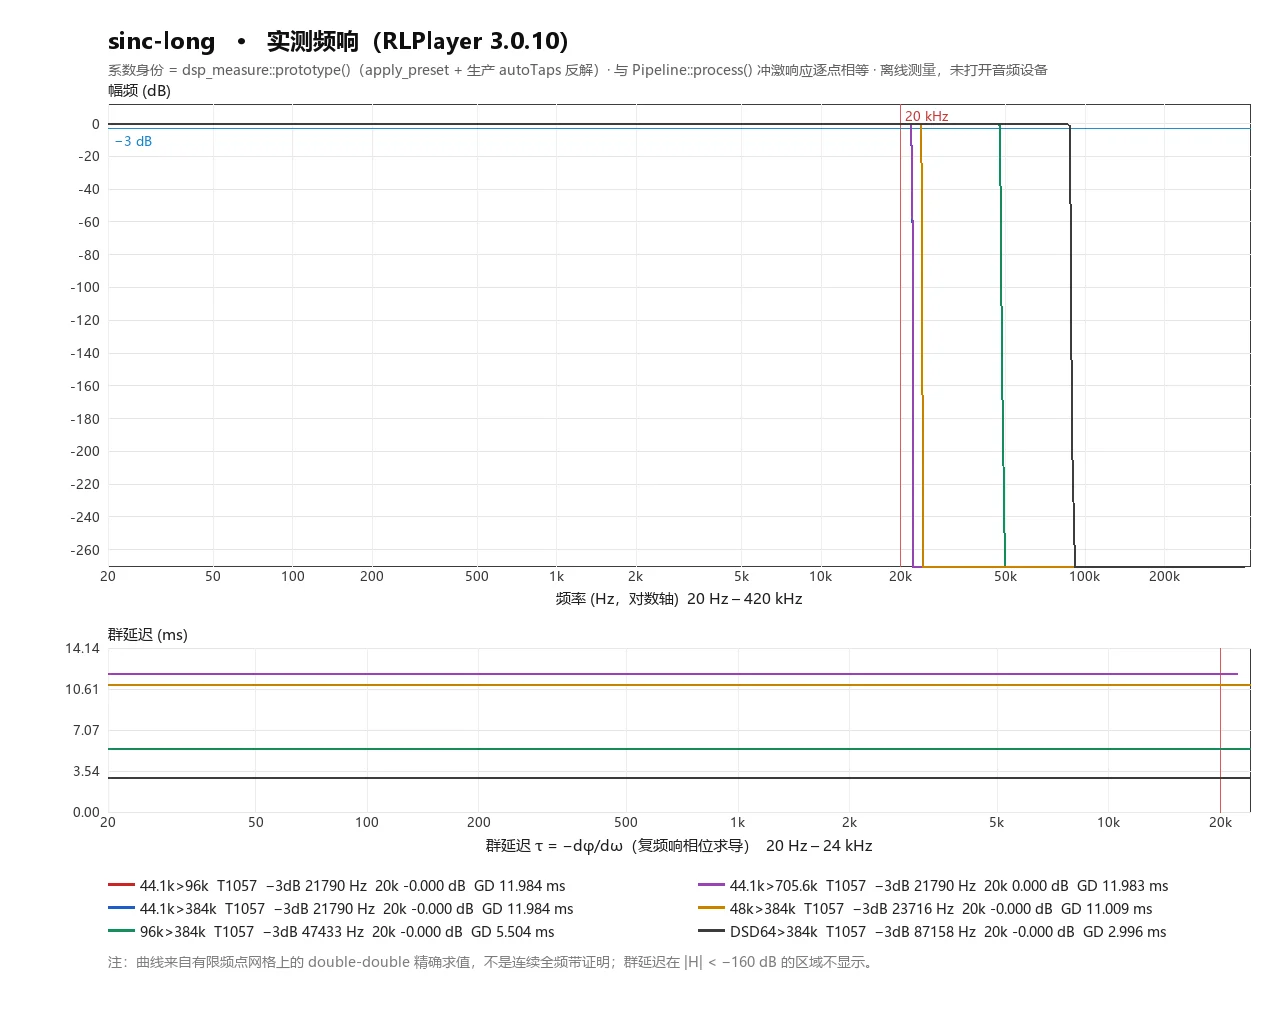
| sinc-long | 1057 | -0.000 | 21790 | -284.82 @ 22506 | 11.984 | OK |
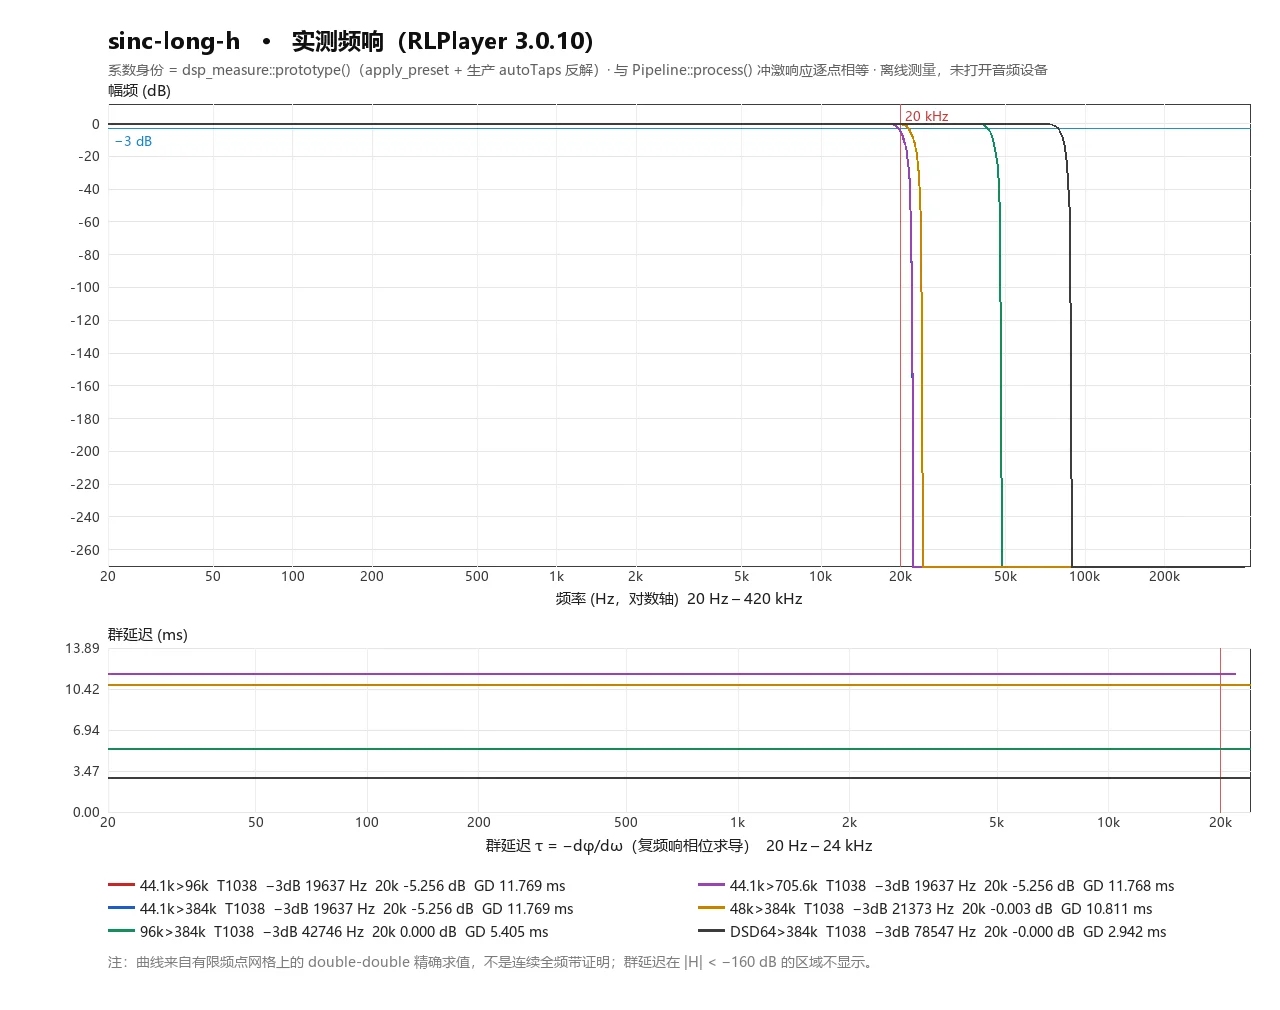
| sinc-long-h | 1038 | -5.256 | 19637 | -313.59 @ 98097 | 11.769 | OK |
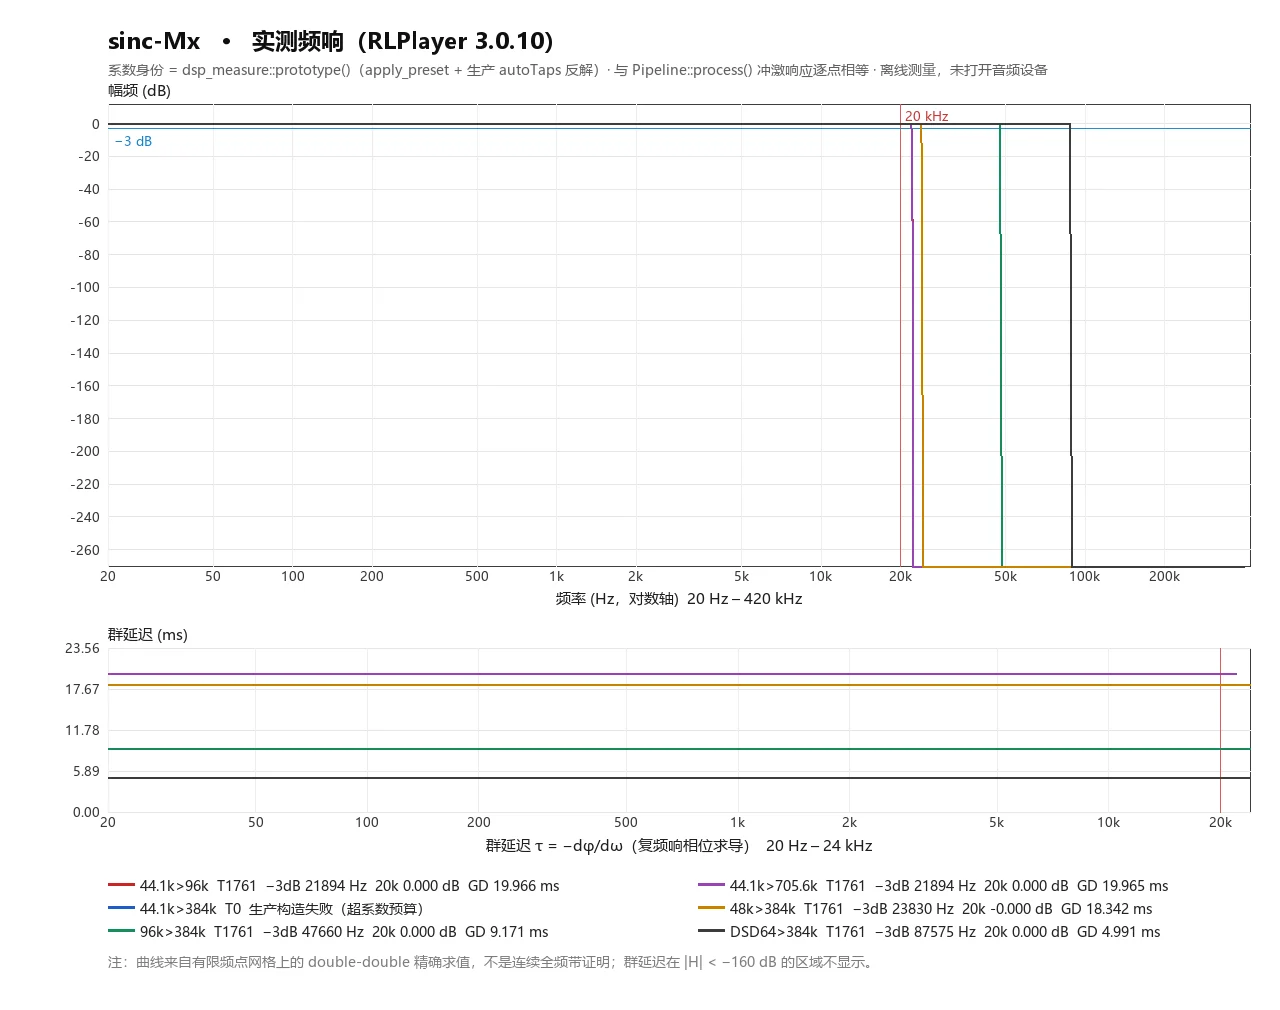
| sinc-Mx | — | — | — | — | — | Failed to construct |
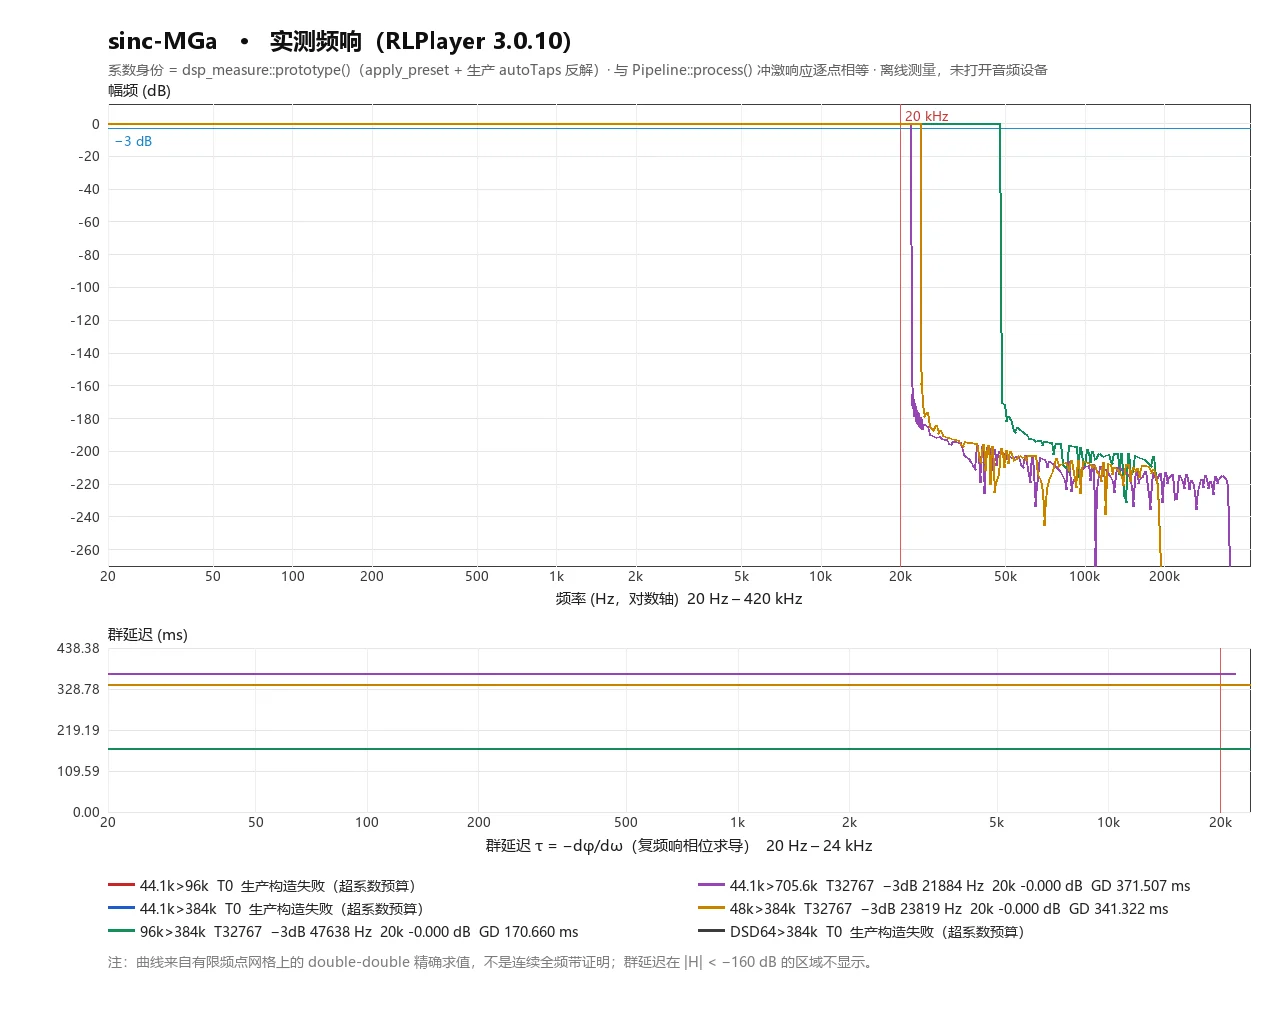
| sinc-MGa | — | — | — | — | — | Failed to construct |
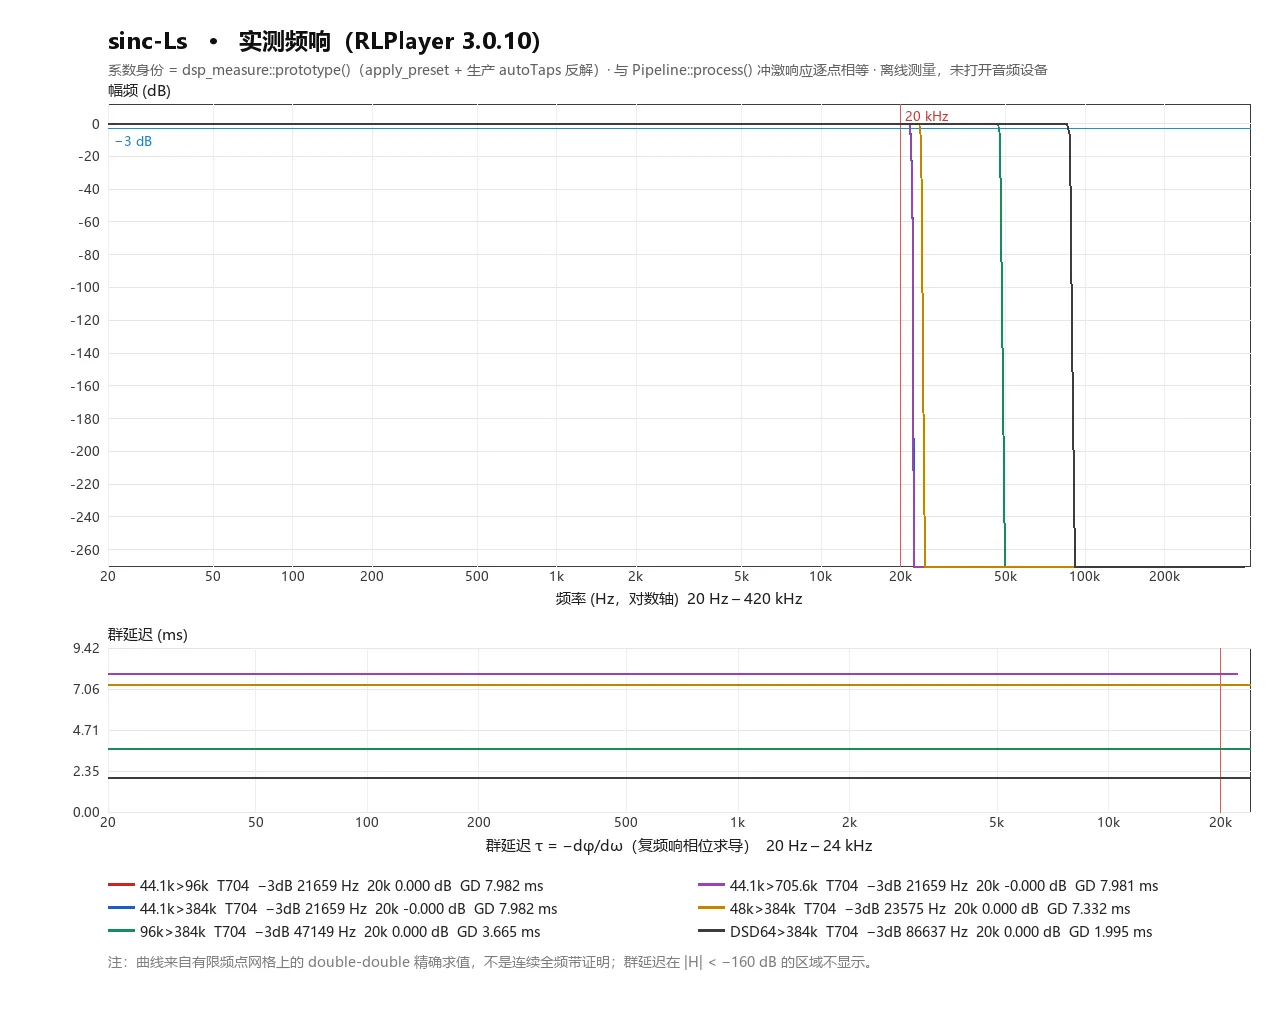
| sinc-Ls | 704 | -0.000 | 21659 | -284.62 @ 22734 | 7.982 | OK |
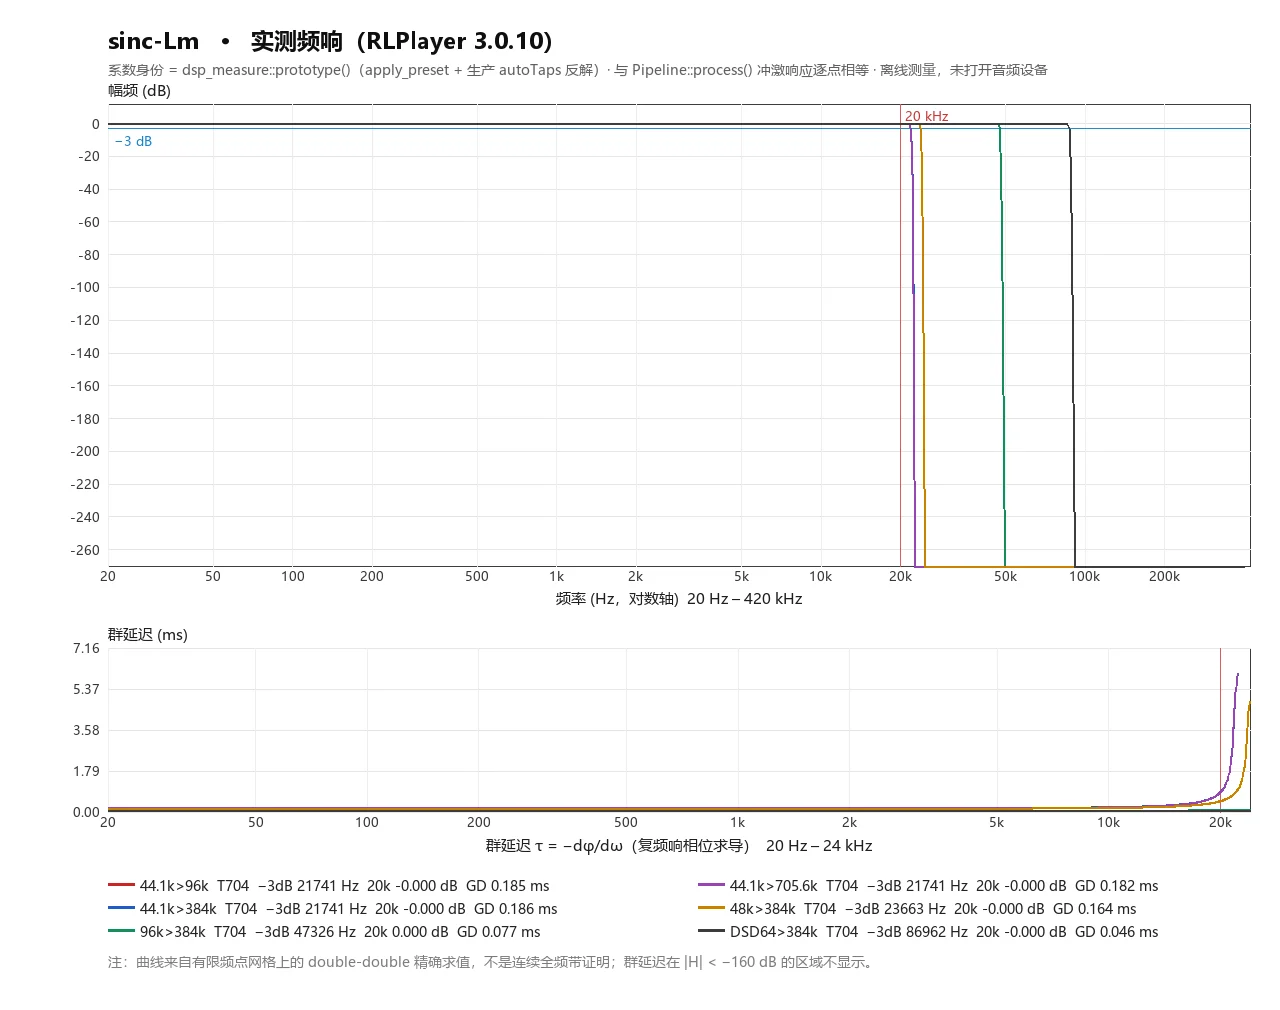
| sinc-Lm | 704 | -0.000 | 21741 | -285.14 @ 22744 | 0.186 | OK |
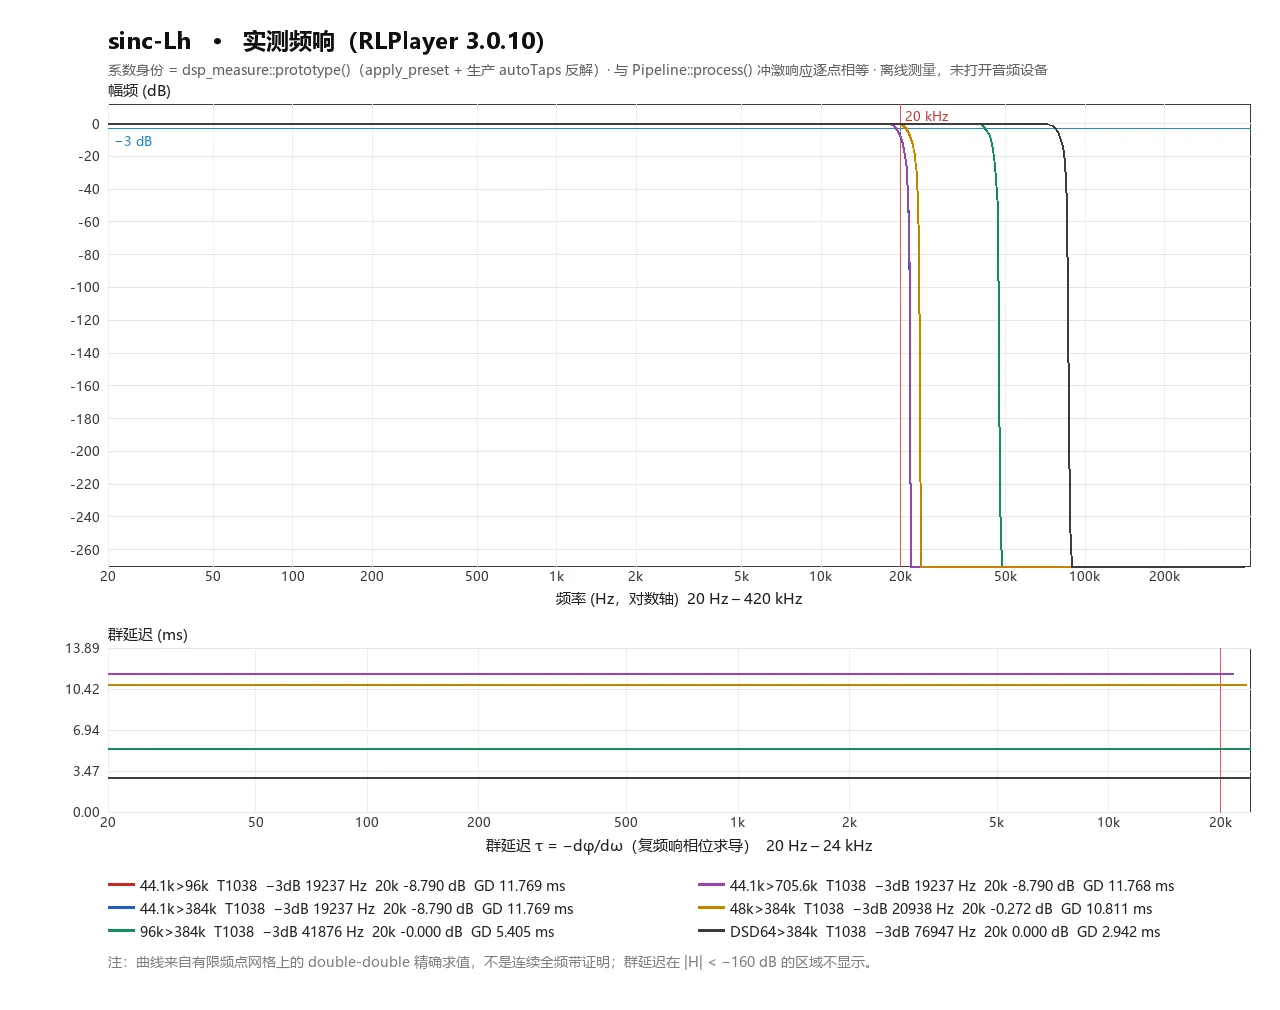
| sinc-Lh | 1038 | -8.790 | 19237 | -314.42 @ 137503 | 11.769 | OK |
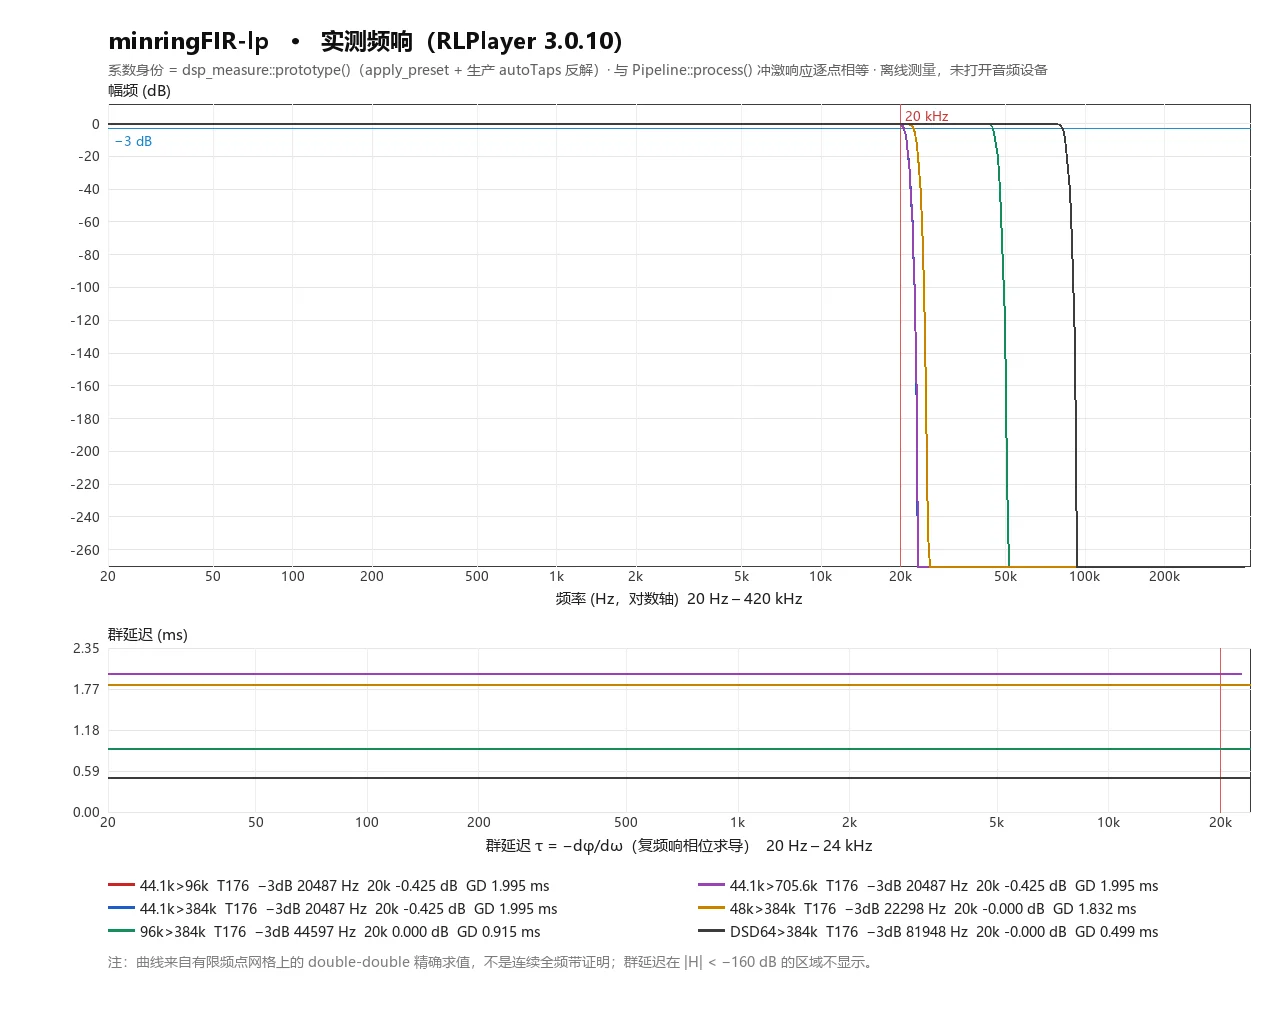
| minringFIR-lp | 176 | -0.425 | 20487 | -284.93 @ 24790 | 1.995 | OK |
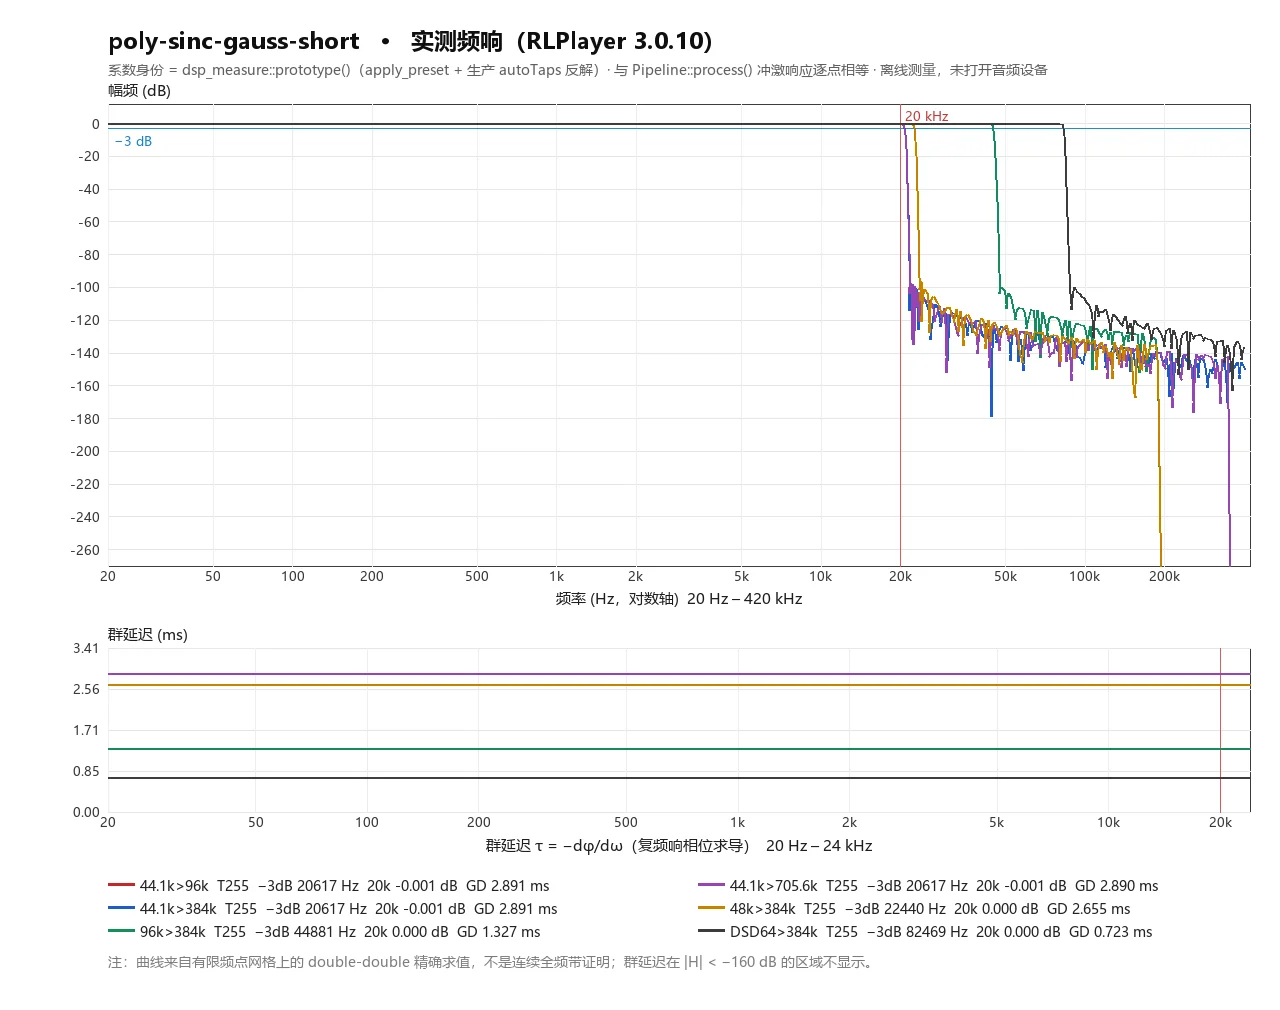
| poly-sinc-gauss-short | 255 | -0.001 | 20617 | -106.03 @ 24709 | 2.891 | OK |
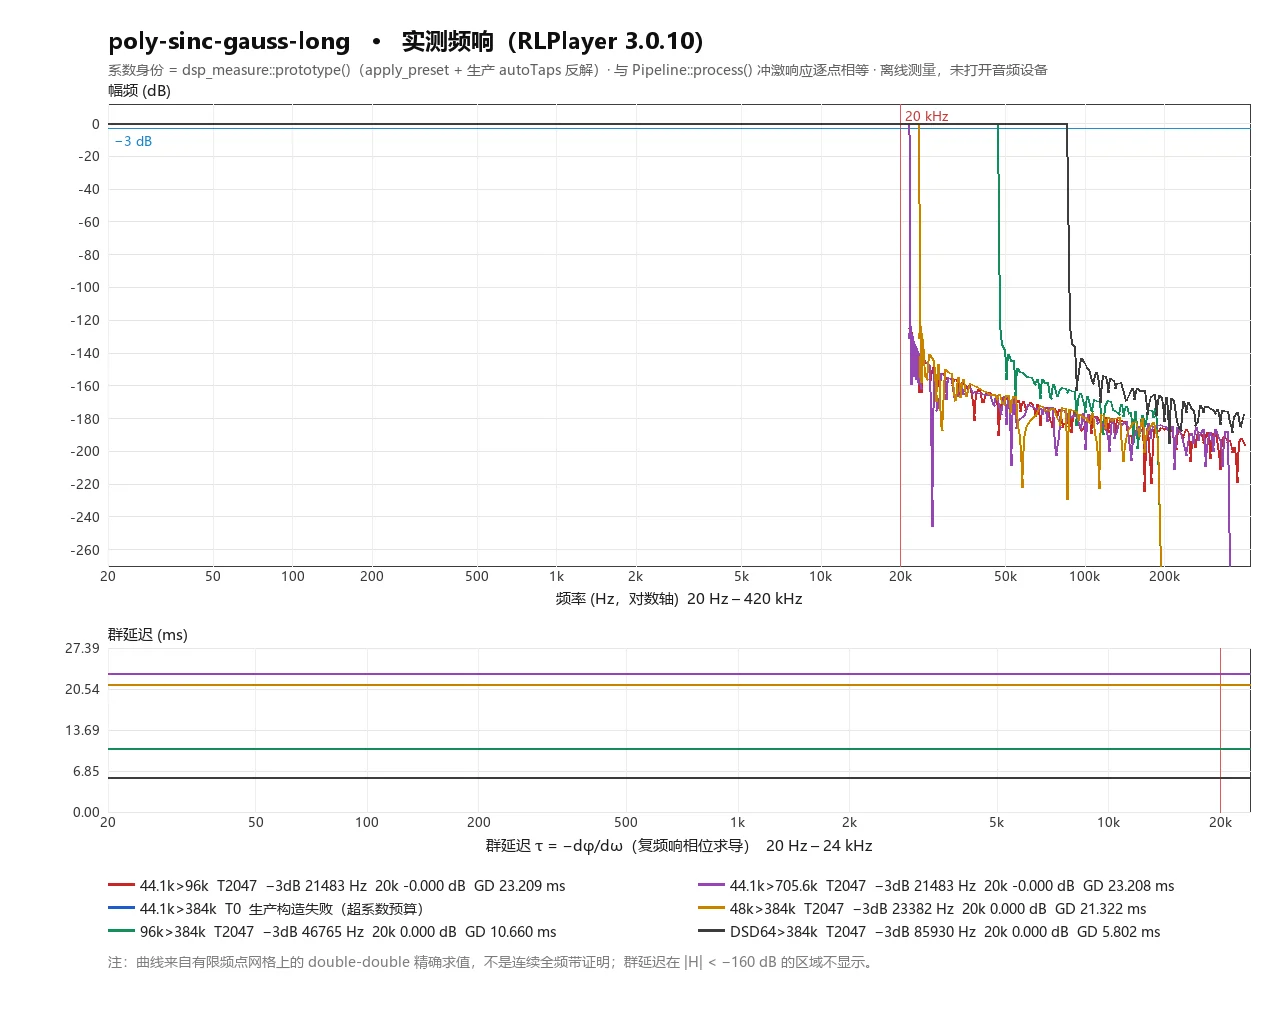
| poly-sinc-gauss-long | — | — | — | — | — | Failed to construct |
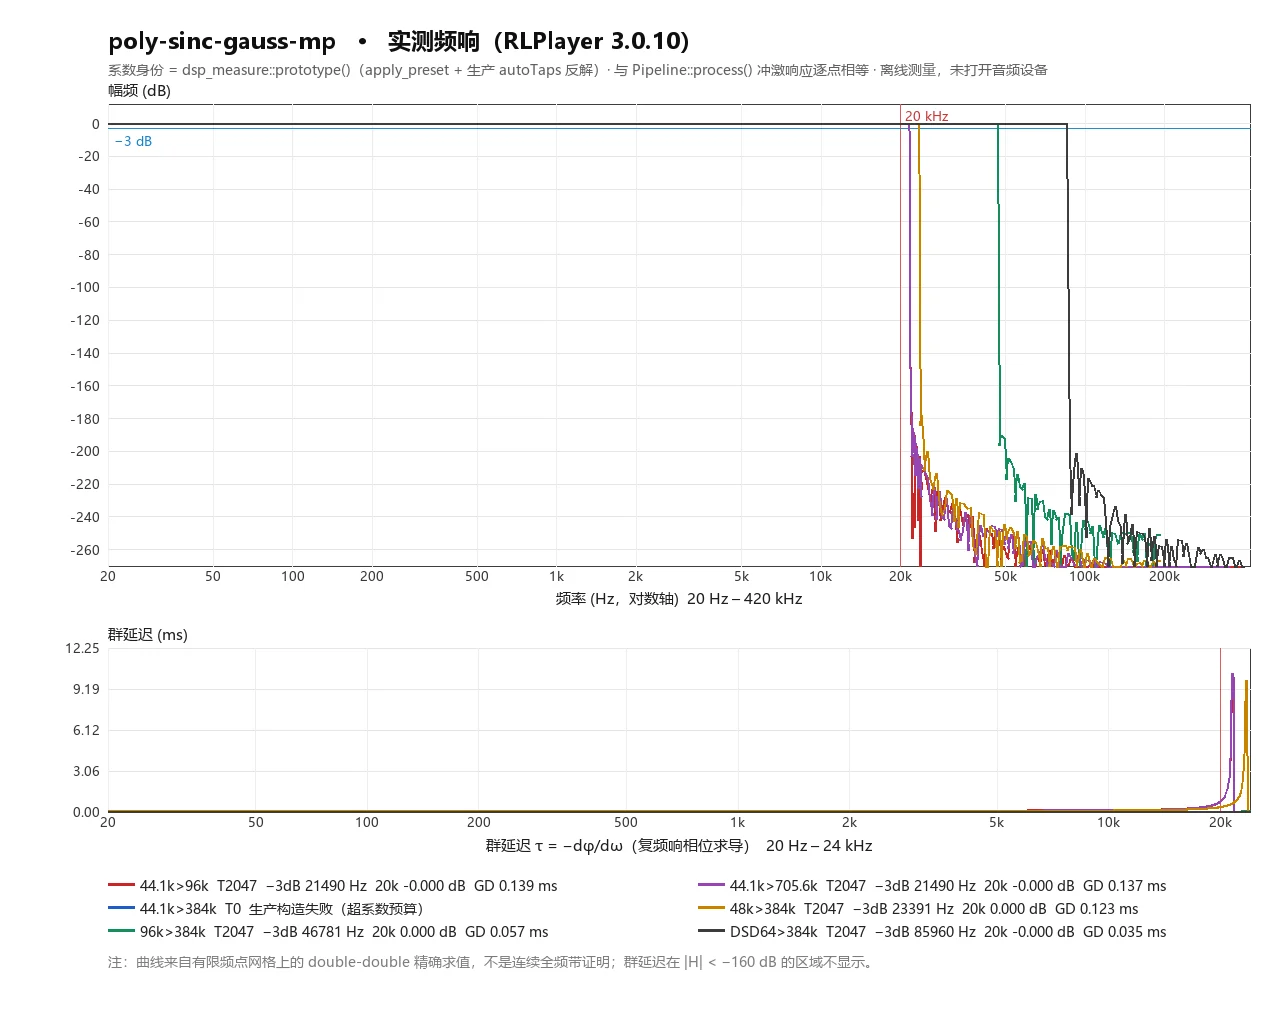
| poly-sinc-gauss-mp | — | — | — | — | — | Failed to construct |
| poly-sinc-gauss-2s | — | — | — | — | — | Failed to construct |
| poly-sinc-gauss-long-2s | — | — | — | — | — | Failed to construct |
| poly-sinc-gauss-hires-lp | — | — | — | — | — | Failed to construct |
| poly-sinc-gauss-hires-mp | — | — | — | — | — | Failed to construct |
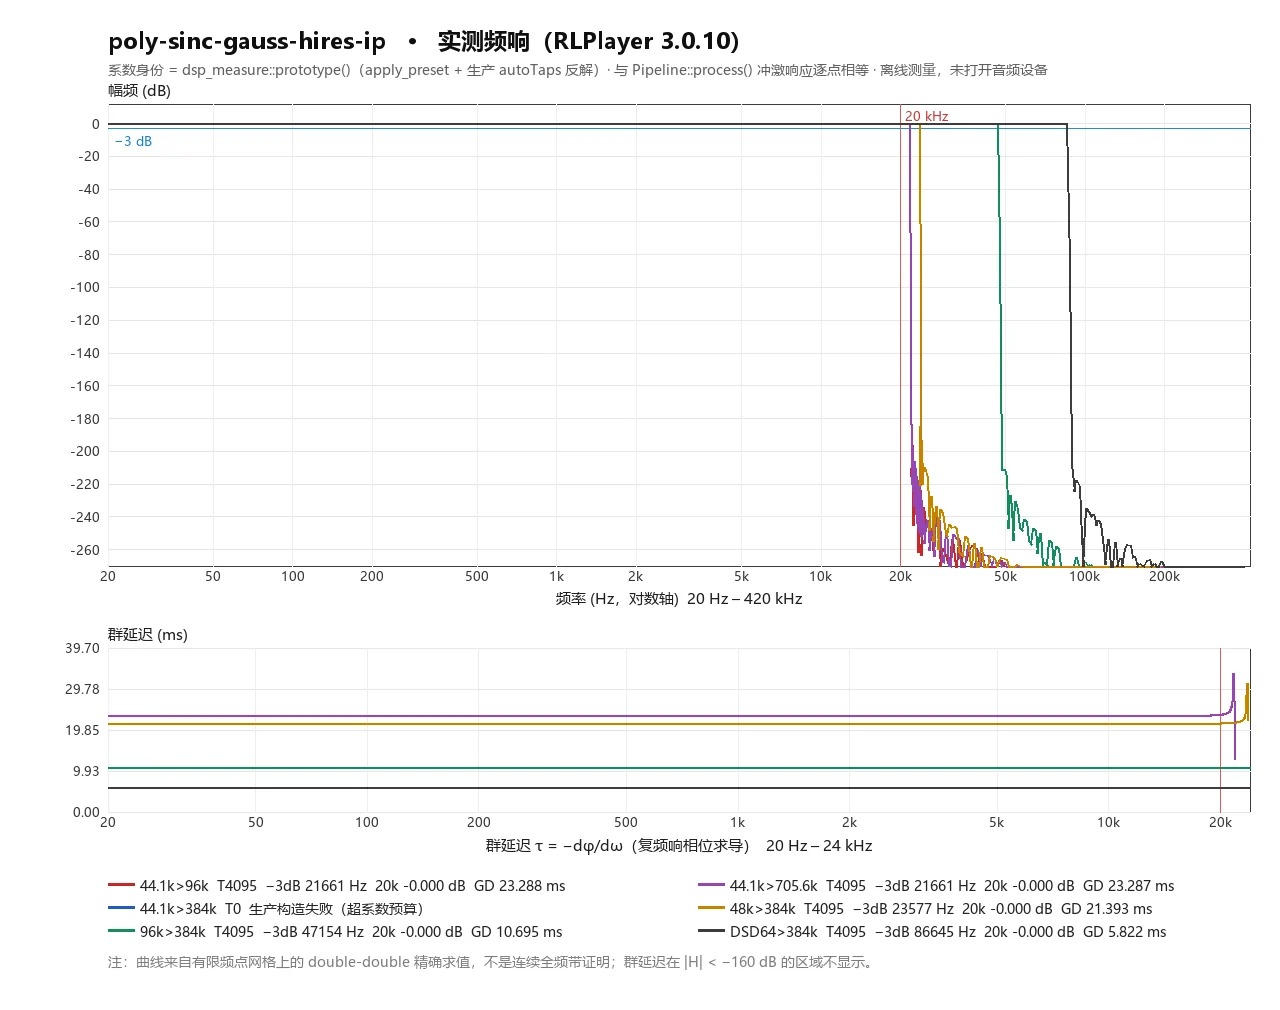
| poly-sinc-gauss-hires-ip | — | — | — | — | — | Failed to construct |
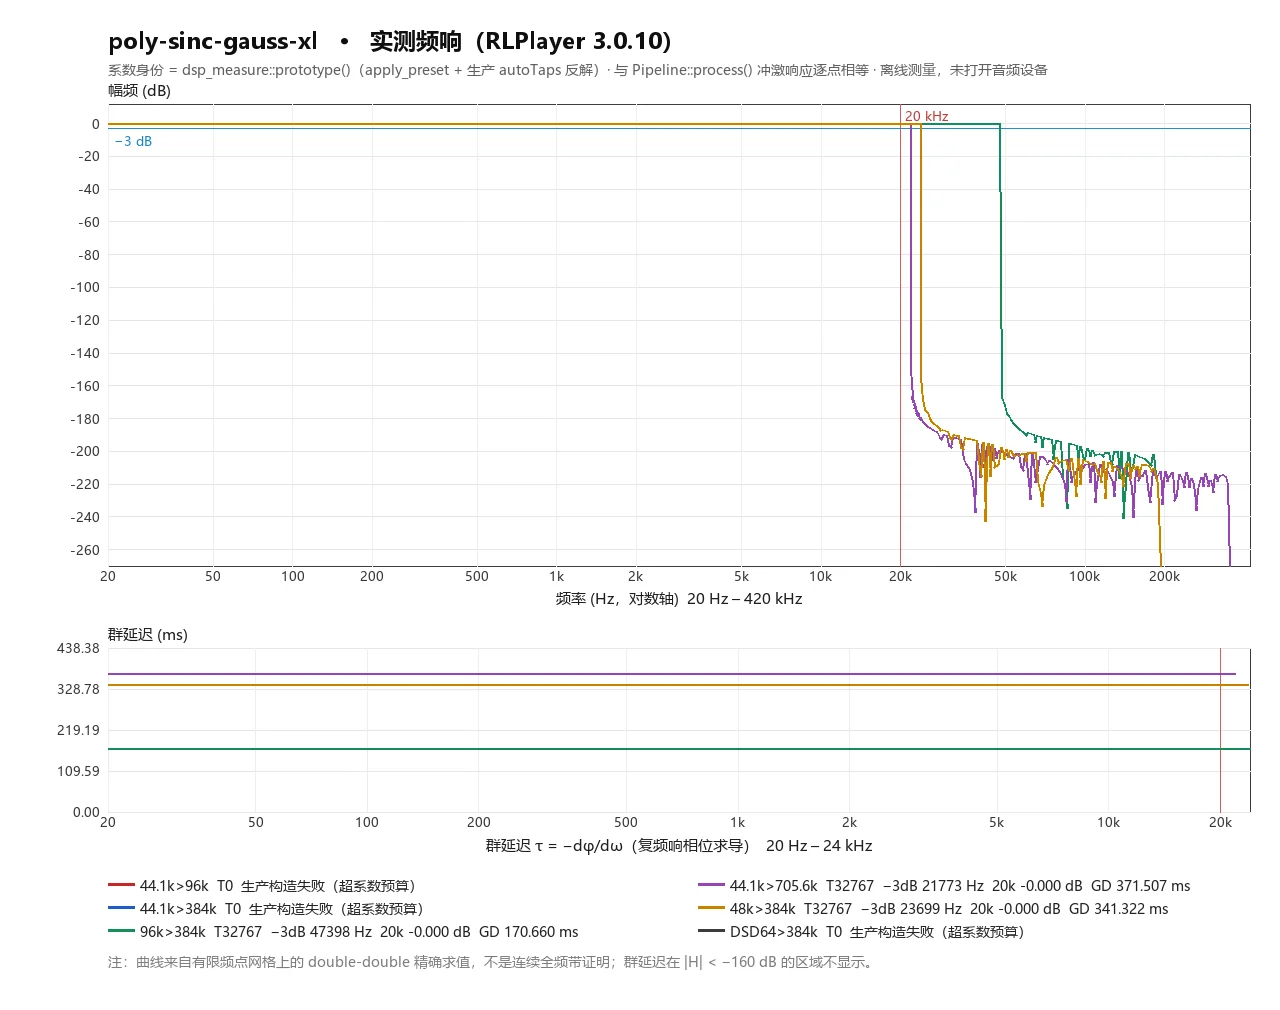
| poly-sinc-gauss-xl | — | — | — | — | — | Failed to construct |
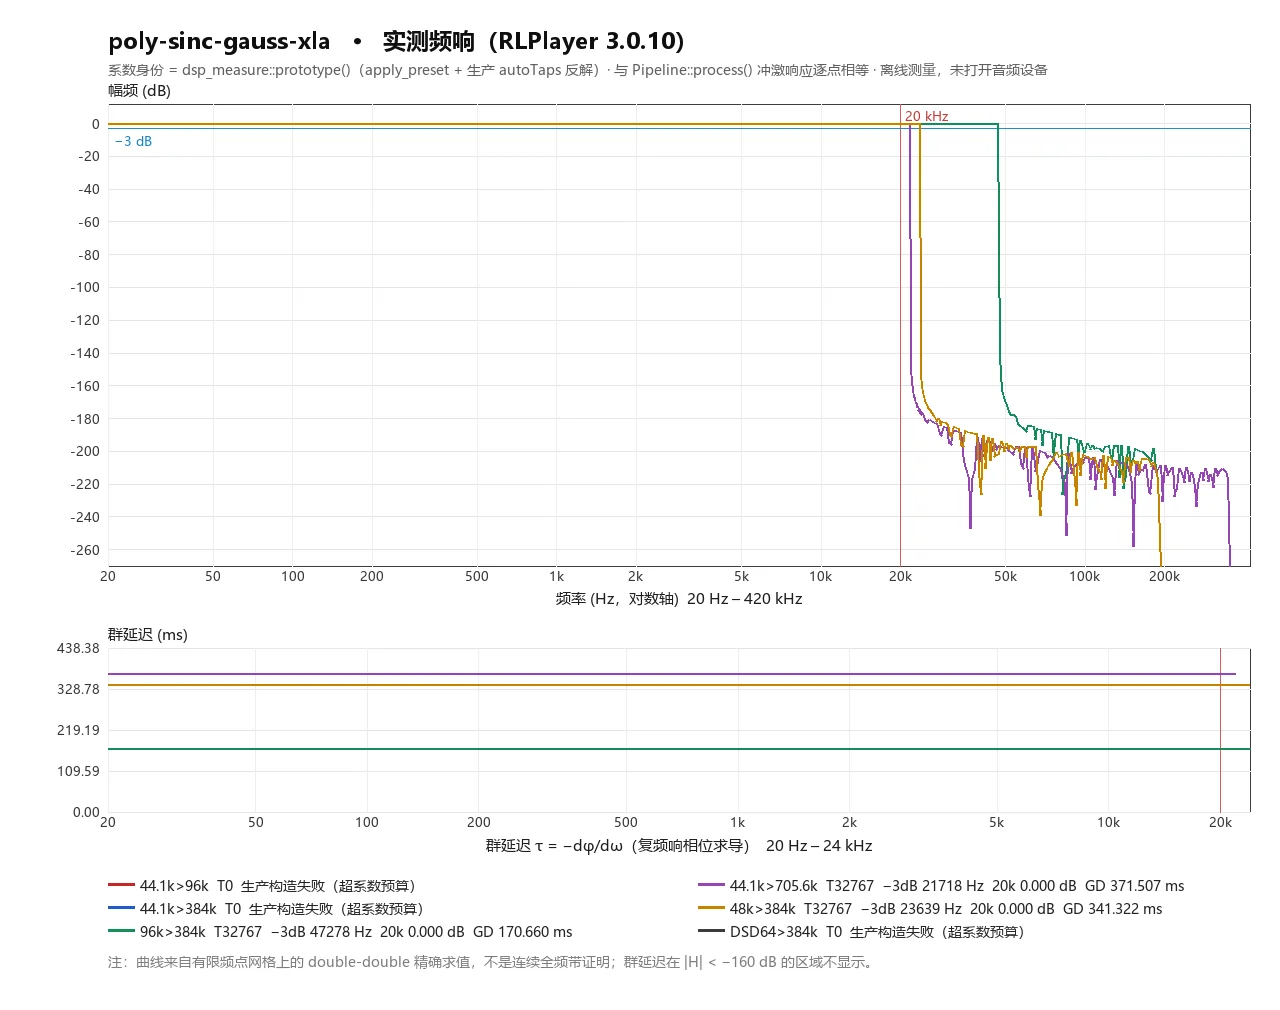
| poly-sinc-gauss-xla | — | — | — | — | — | Failed to construct |
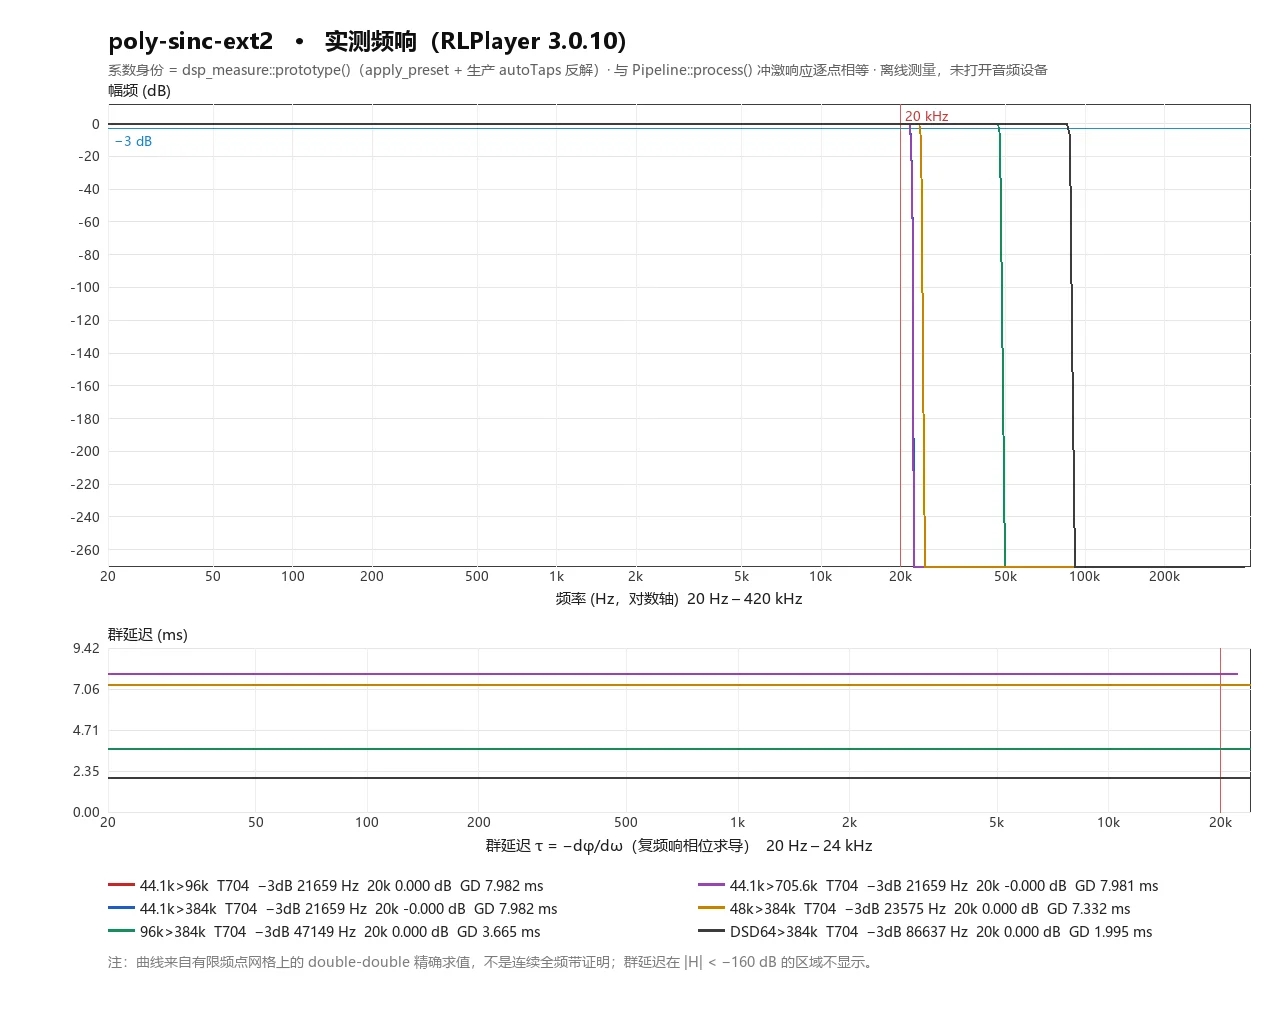
| poly-sinc-ext2 | 704 | -0.000 | 21659 | -284.62 @ 22734 | 7.982 | OK |
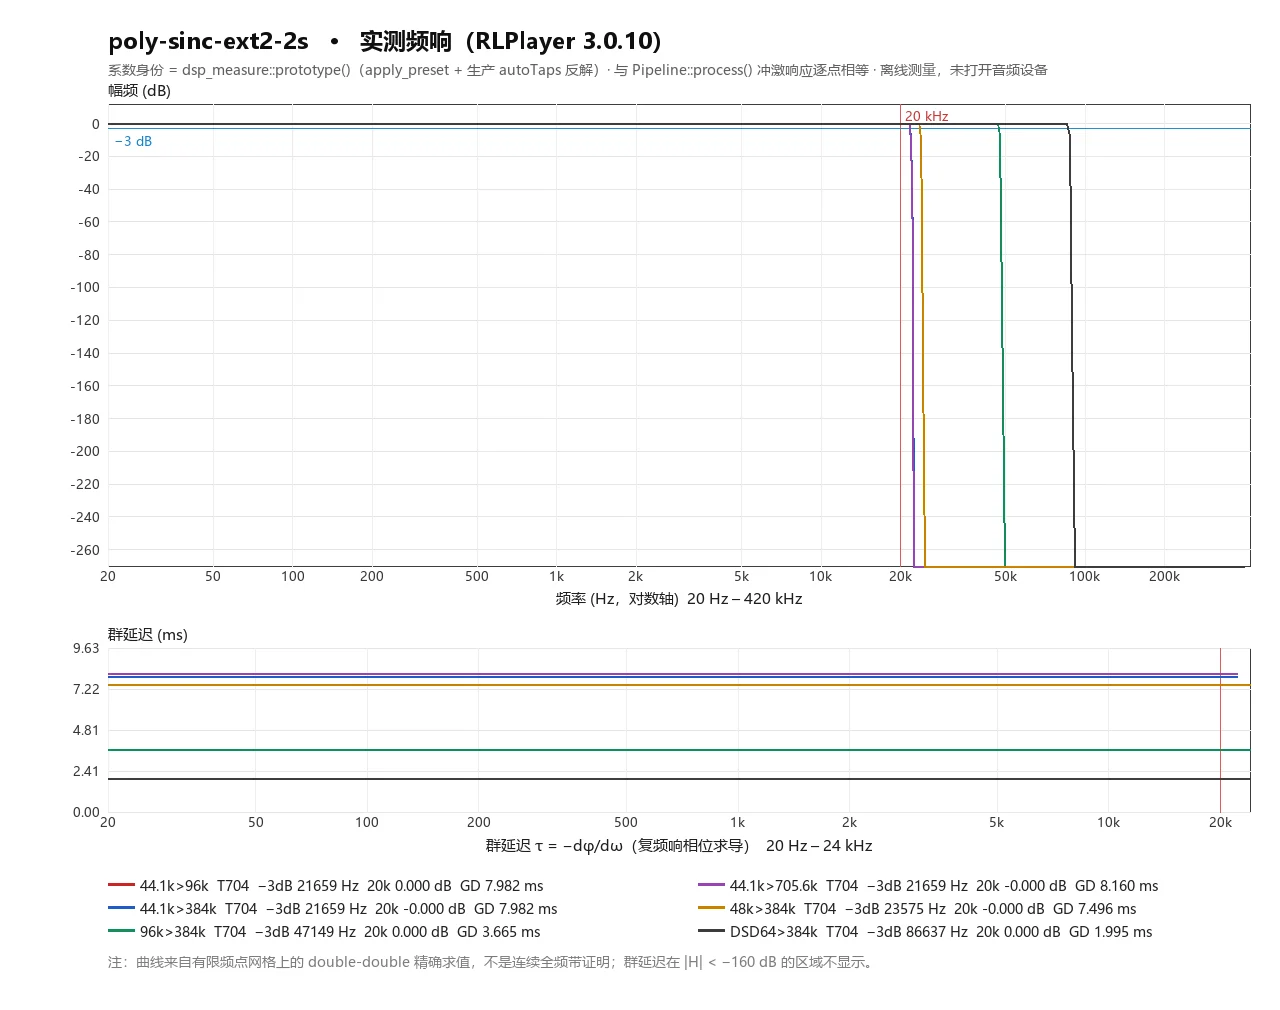
| poly-sinc-ext2-2s | 704 | -0.000 | 21659 | -284.62 @ 22734 | 7.982 | OK |
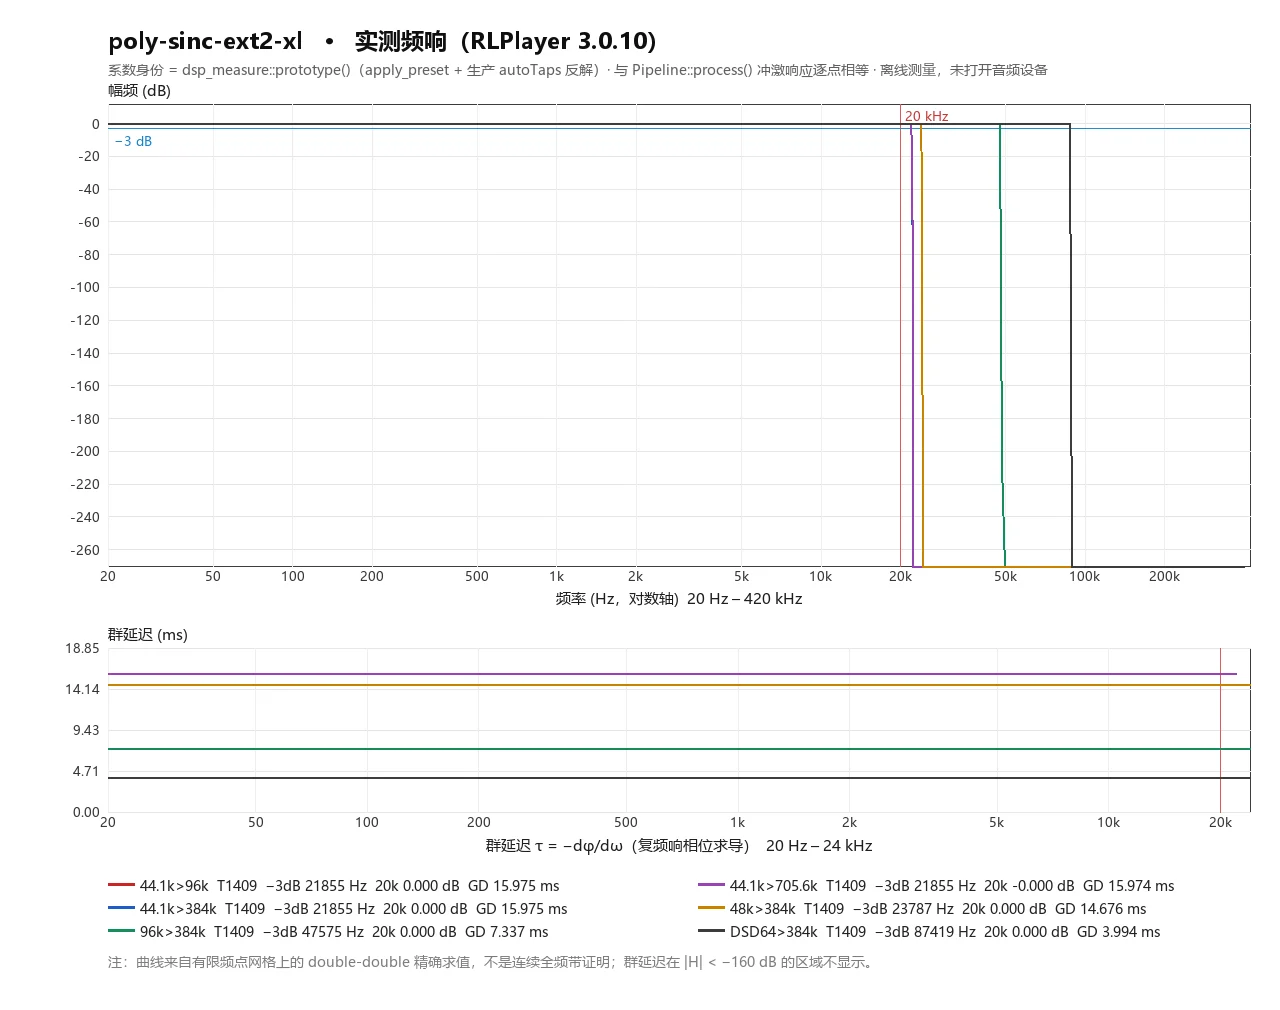
| poly-sinc-ext2-xl | 1409 | 0.000 | 21855 | -284.83 @ 22391 | 15.975 | OK |
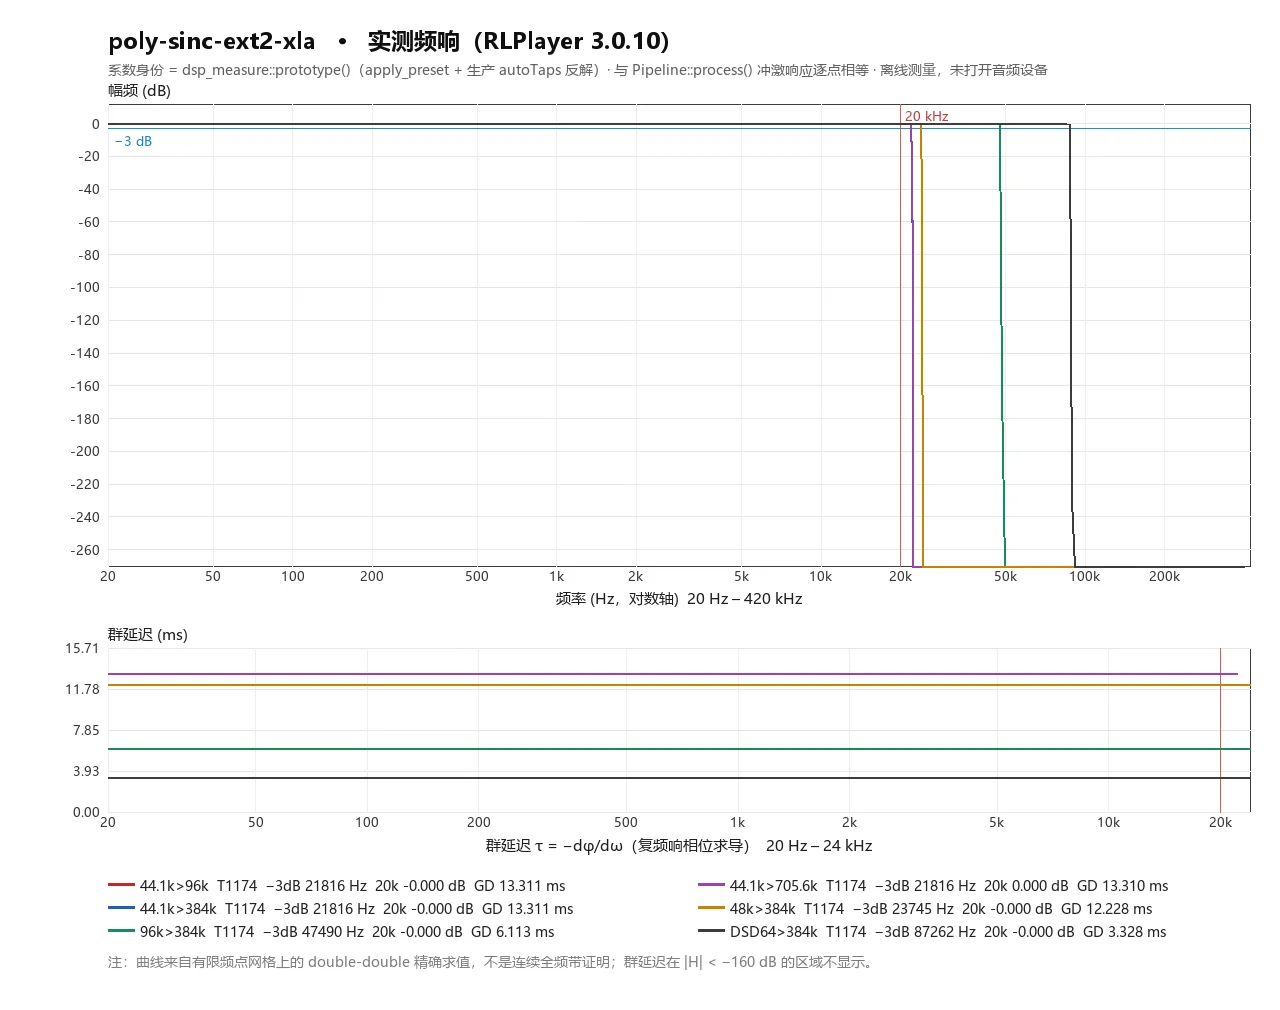
| poly-sinc-ext2-xla | 1174 | -0.000 | 21816 | -284.77 @ 22460 | 13.311 | OK |
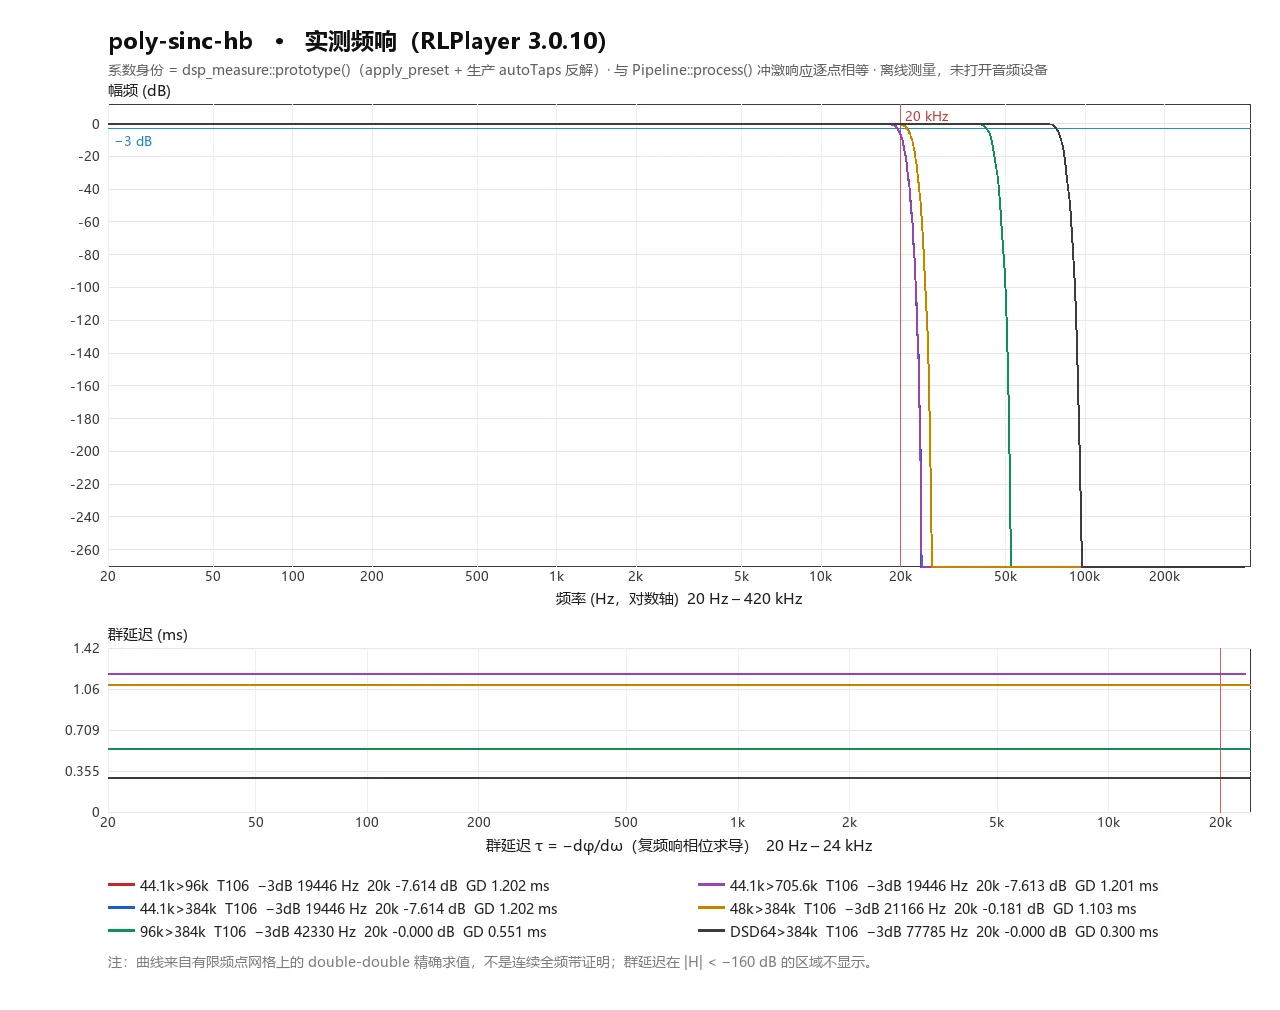
| poly-sinc-hb | 106 | -7.614 | 19446 | -285.87 @ 26594 | 1.202 | OK |
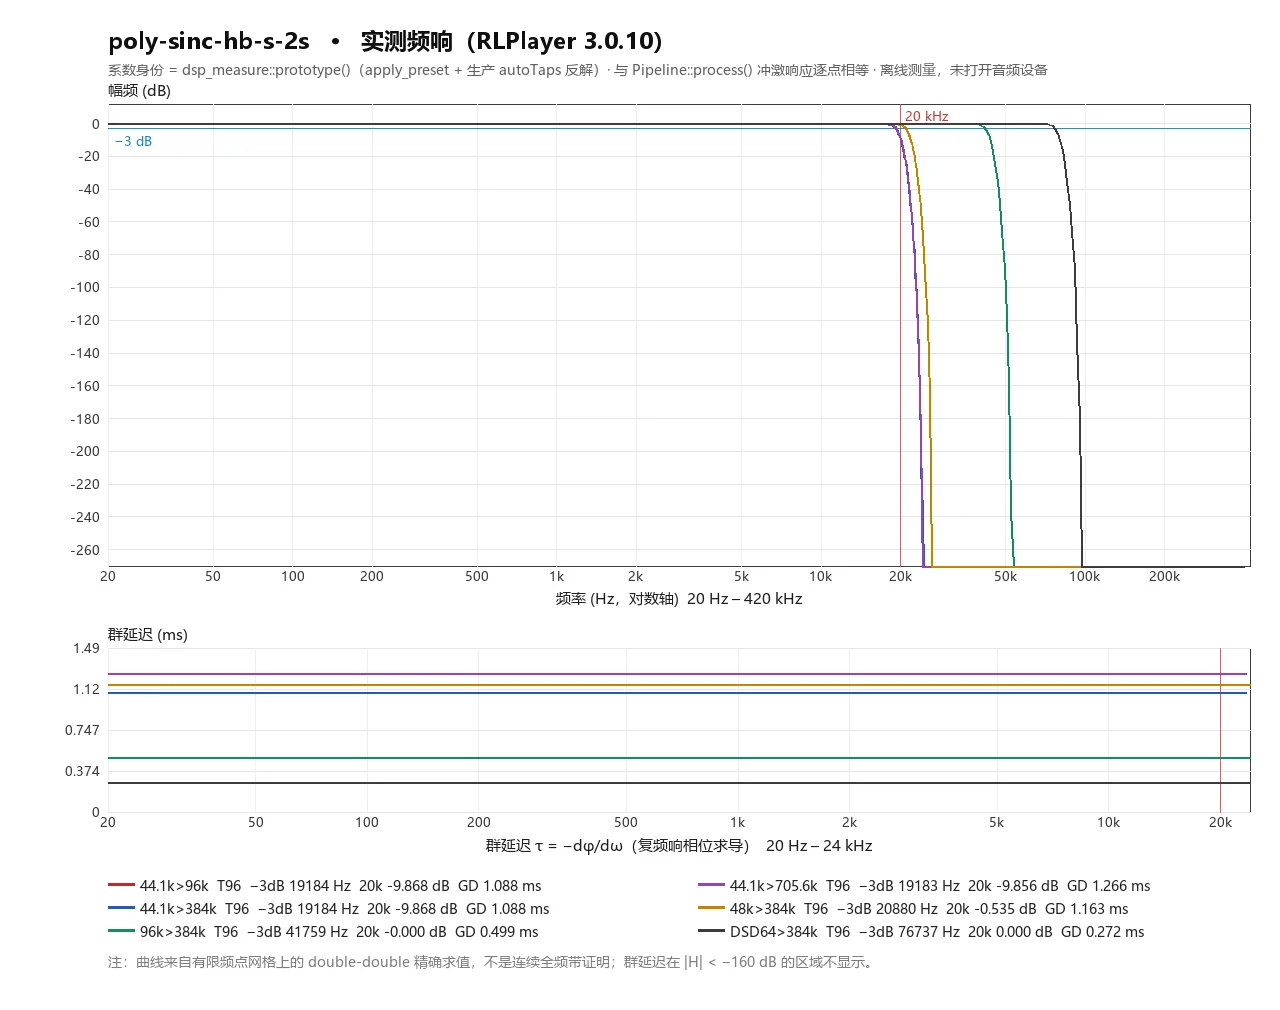
| poly-sinc-hb-s | 85 | -13.185 | 18797 | -283.44 @ 27697 | 0.964 | OK |
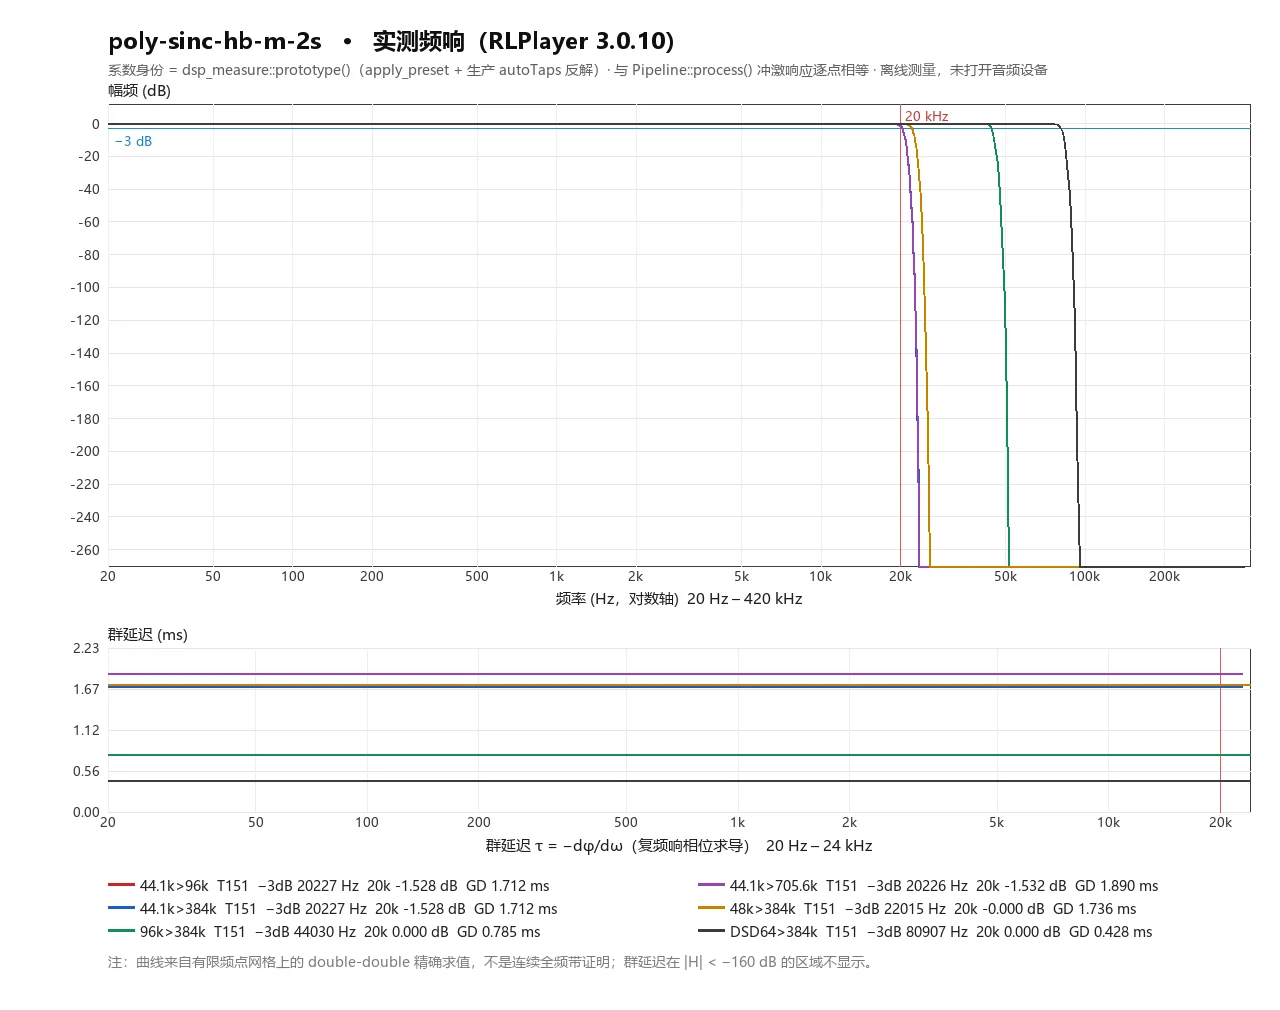
| poly-sinc-hb-m | 141 | -2.331 | 20097 | -284.40 @ 25719 | 1.599 | OK |
| poly-sinc-hb-l | 211 | -0.035 | 20747 | -284.50 @ 24333 | 2.392 | OK |
| poly-sinc-hb-2s | 132 | -3.264 | 19966 | -285.48 @ 25705 | 1.497 | OK |
| poly-sinc-hb-s-2s | 96 | -9.868 | 19184 | -286.08 @ 27078 | 1.088 | OK |
| poly-sinc-hb-m-2s | 151 | -1.528 | 20227 | -284.30 @ 25234 | 1.712 | OK |
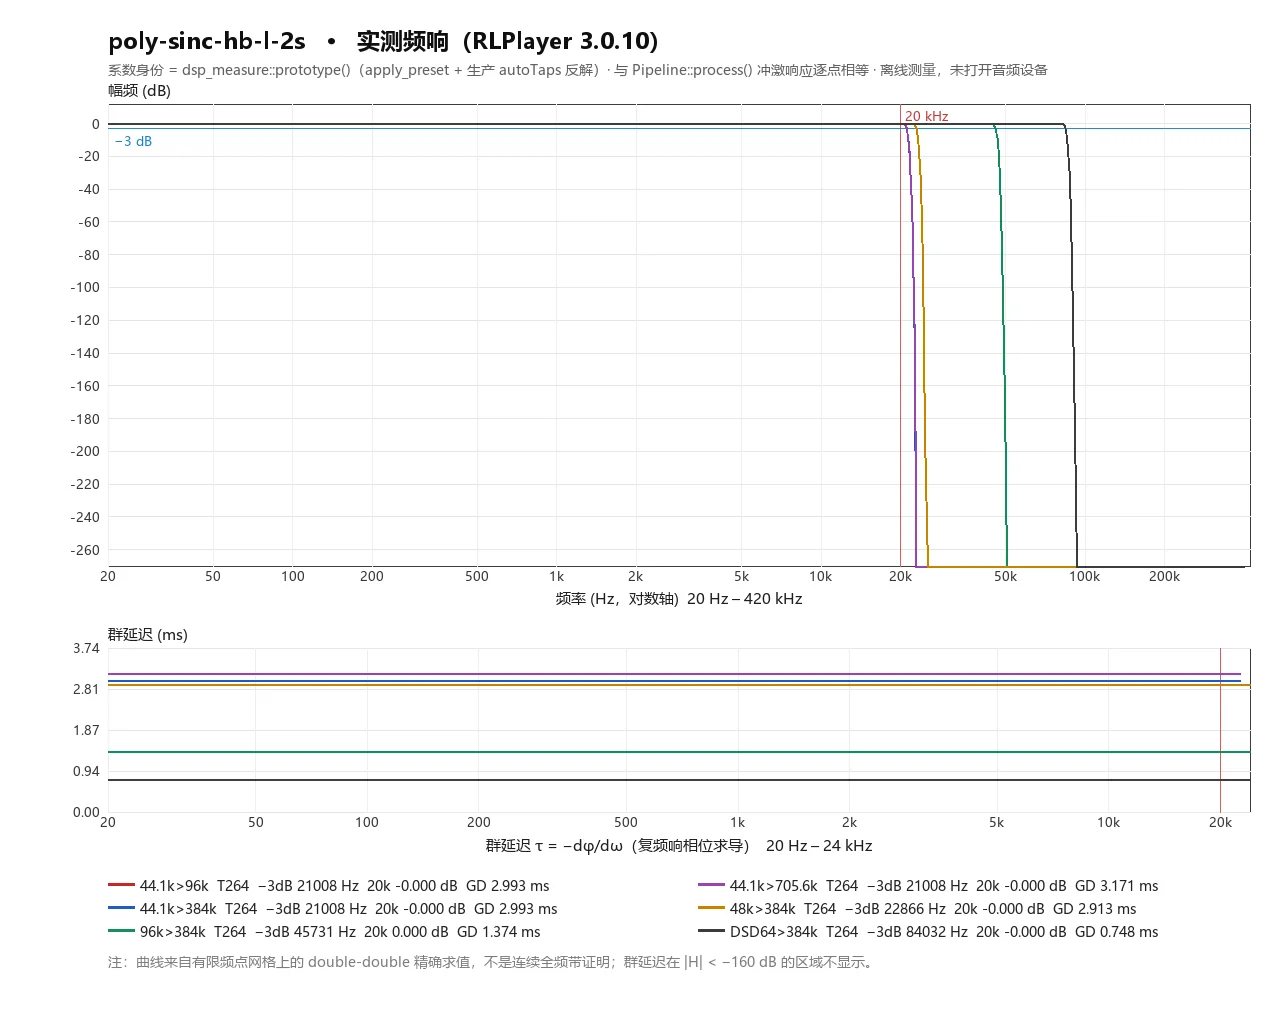
| poly-sinc-hb-l-2s | 264 | -0.000 | 21008 | -284.83 @ 23875 | 2.993 | OK |
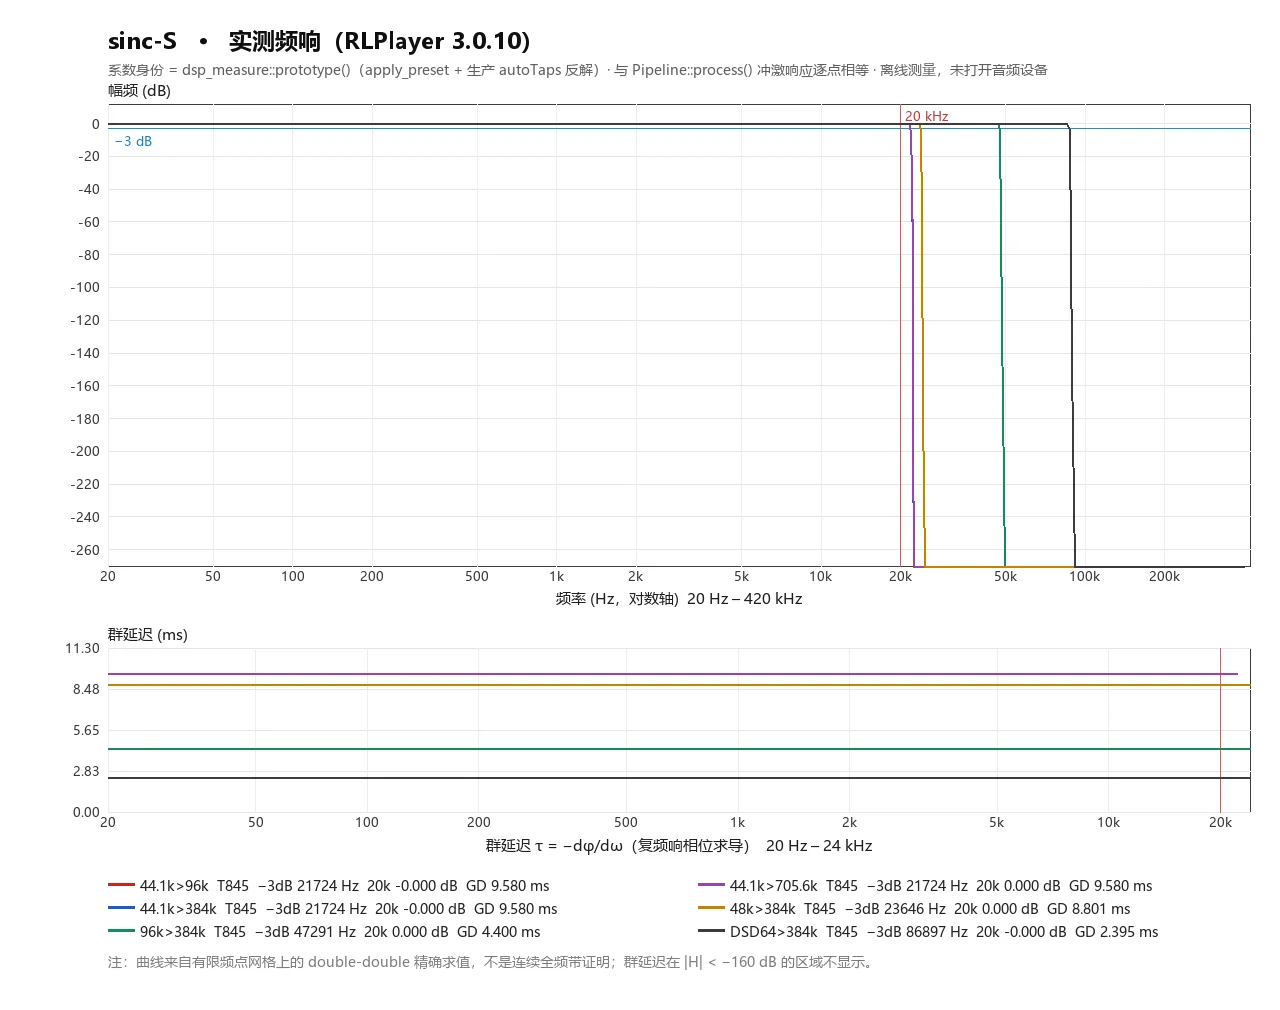
| sinc-S | 845 | -0.000 | 21724 | -284.81 @ 22620 | 9.580 | OK |
| sinc-M | — | — | — | — | — | Failed to construct |
| sinc-MG | — | — | — | — | — | Failed to construct |
| sinc-L | — | — | — | — | — | Failed to construct |
| sinc-LL | — | — | — | — | — | Failed to construct |
| closed-form-fast | 211 | -0.035 | 20747 | -284.50 @ 24333 | 2.392 | OK |
| closed-form | 352 | -0.000 | 21268 | -284.75 @ 23417 | 3.991 | OK |
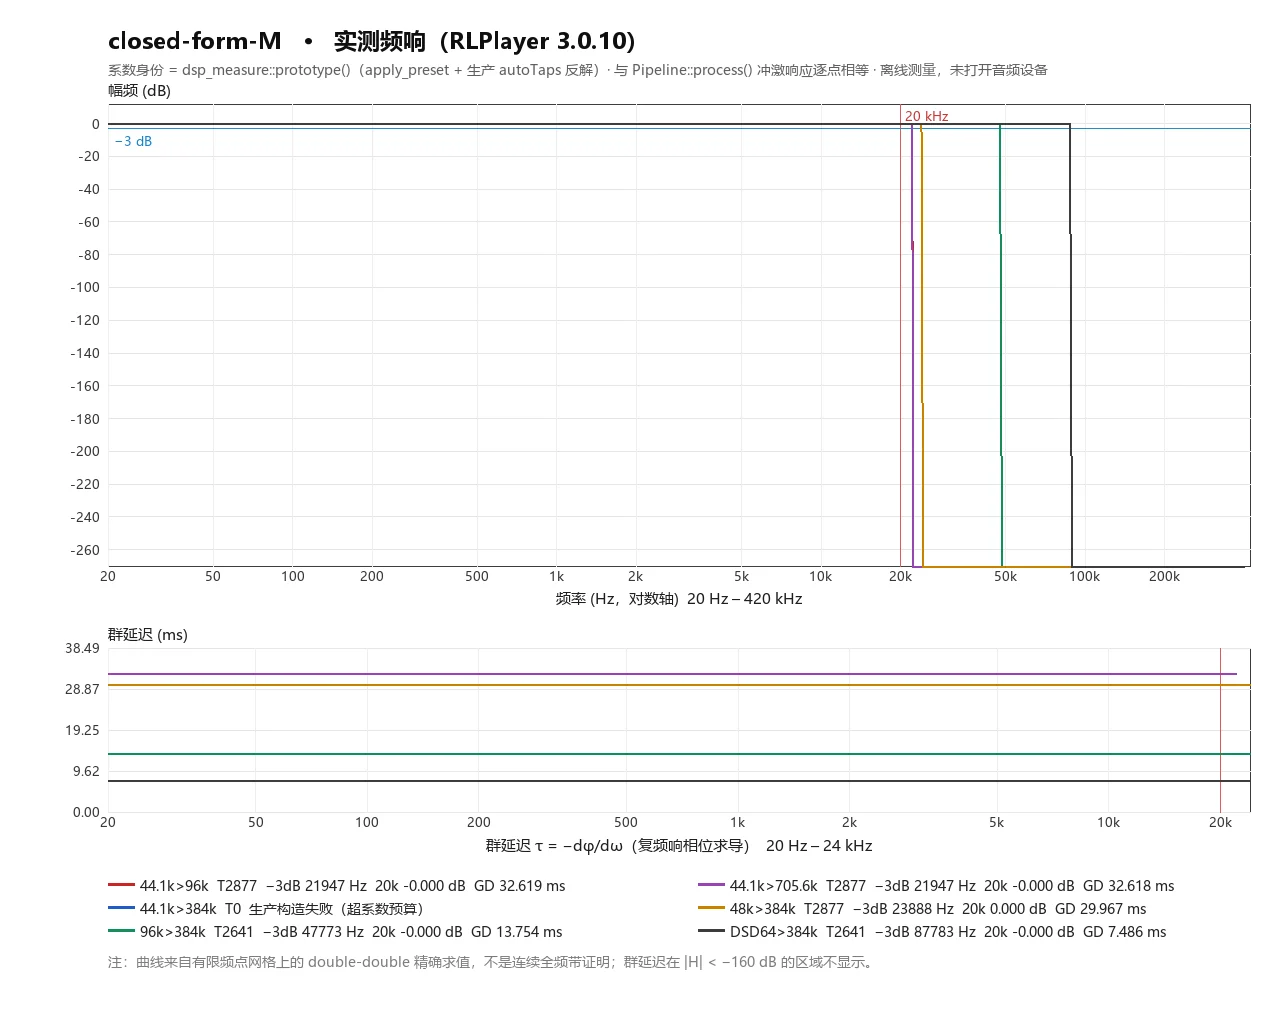
| closed-form-M | — | — | — | — | — | Failed to construct |
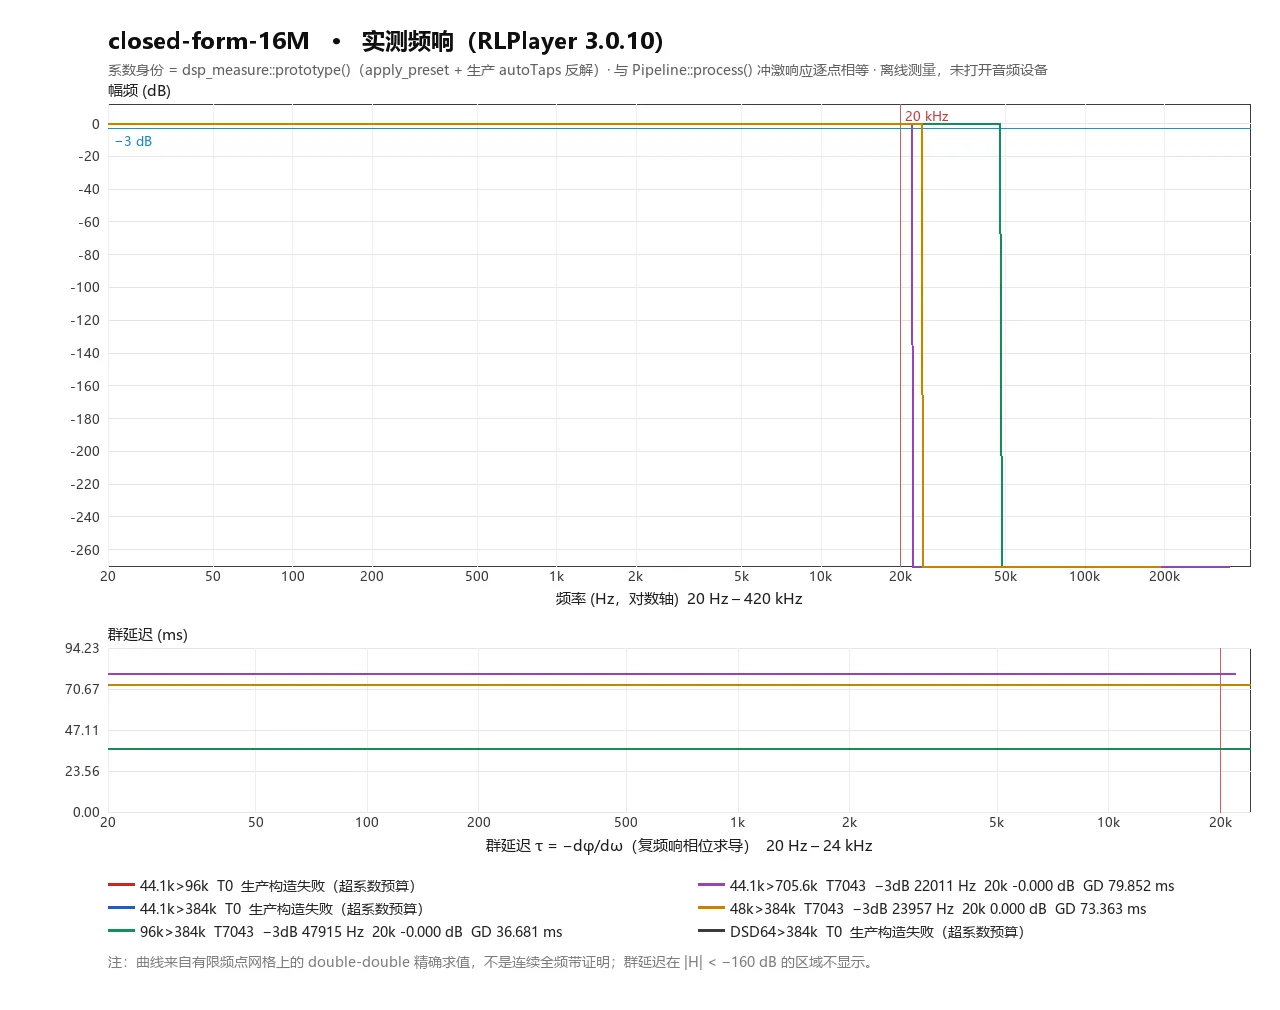
| closed-form-16M | — | — | — | — | — | Failed to construct |
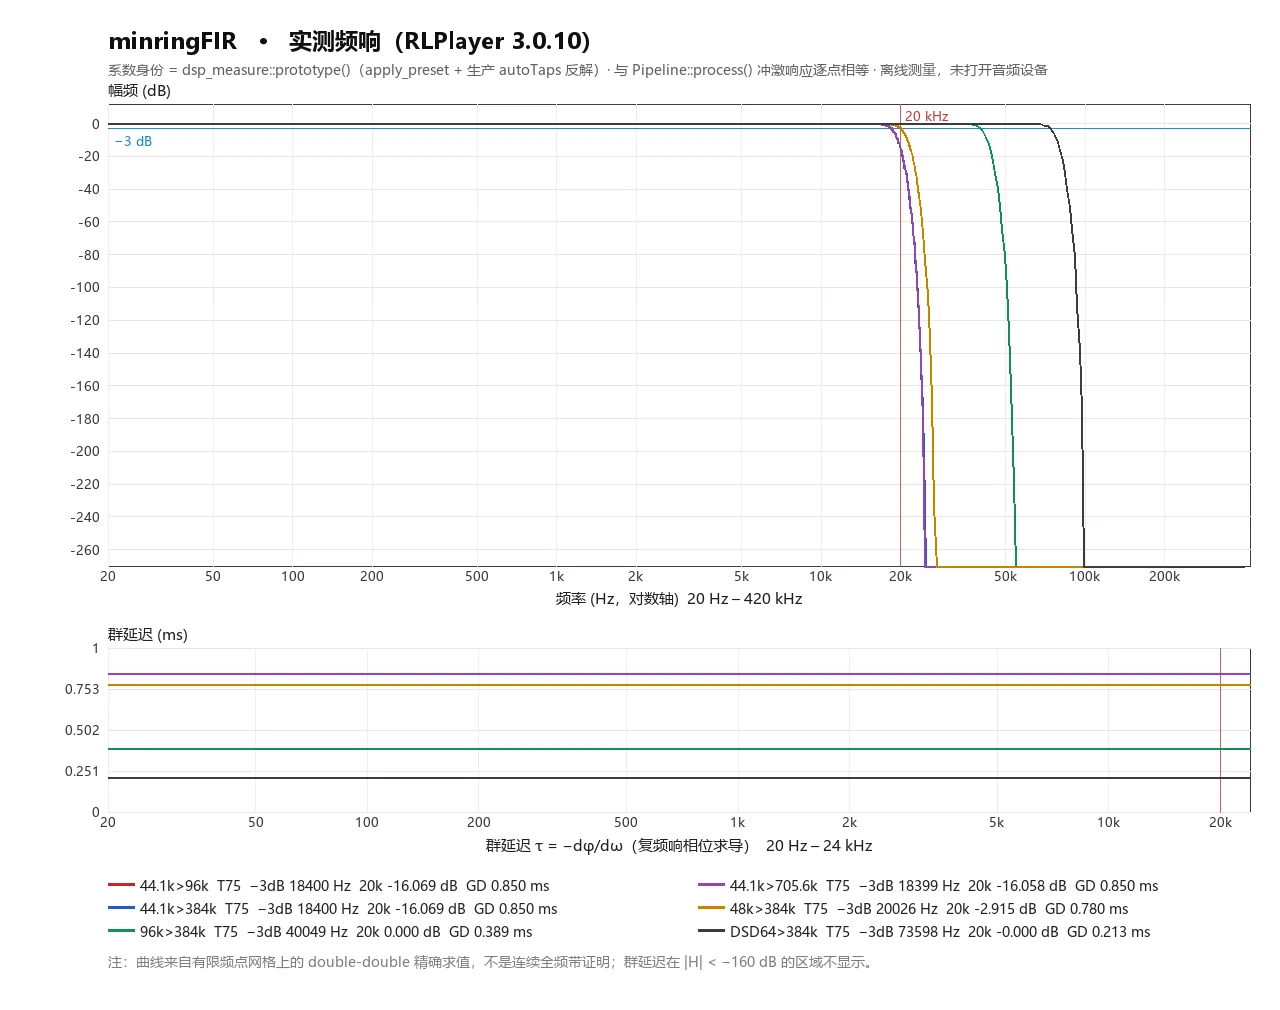
| minringFIR | 75 | -16.069 | 18400 | -283.58 @ 28962 | 0.850 | OK |
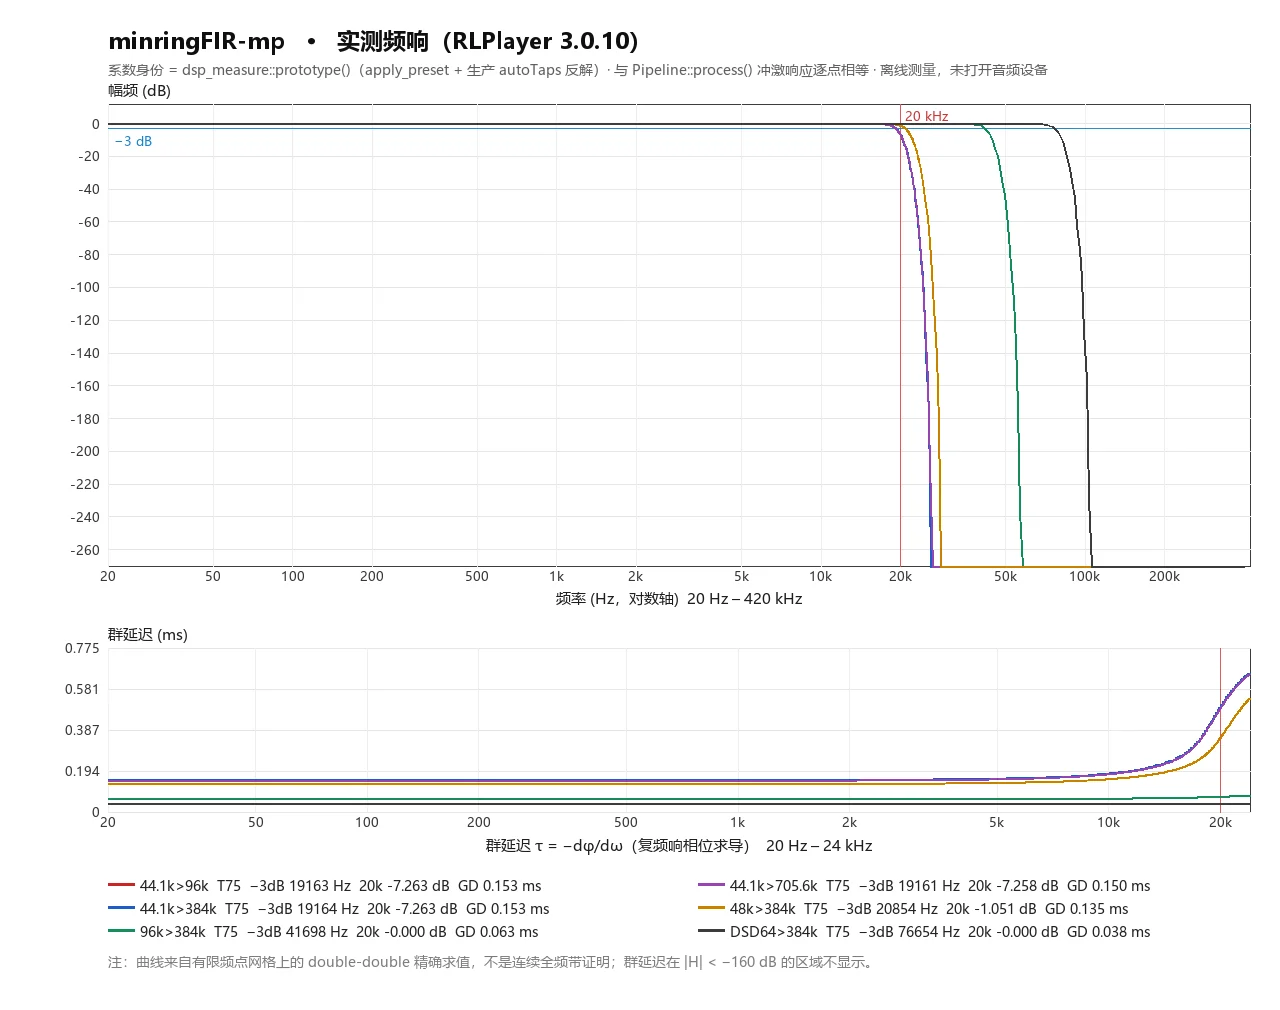
| minringFIR-mp | 75 | -7.263 | 19164 | -284.89 @ 28612 | 0.153 | OK |
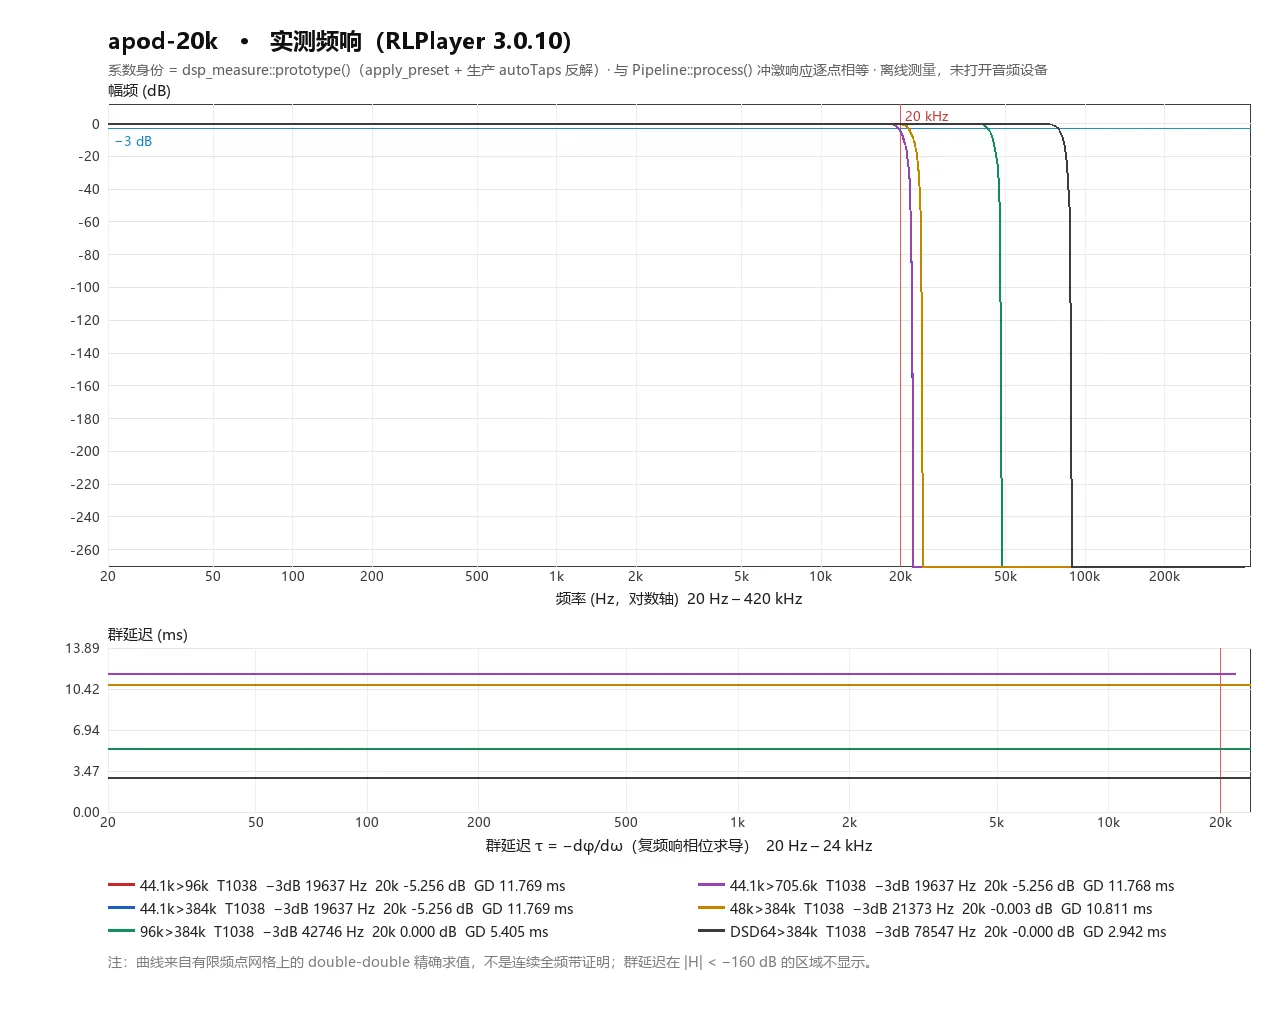
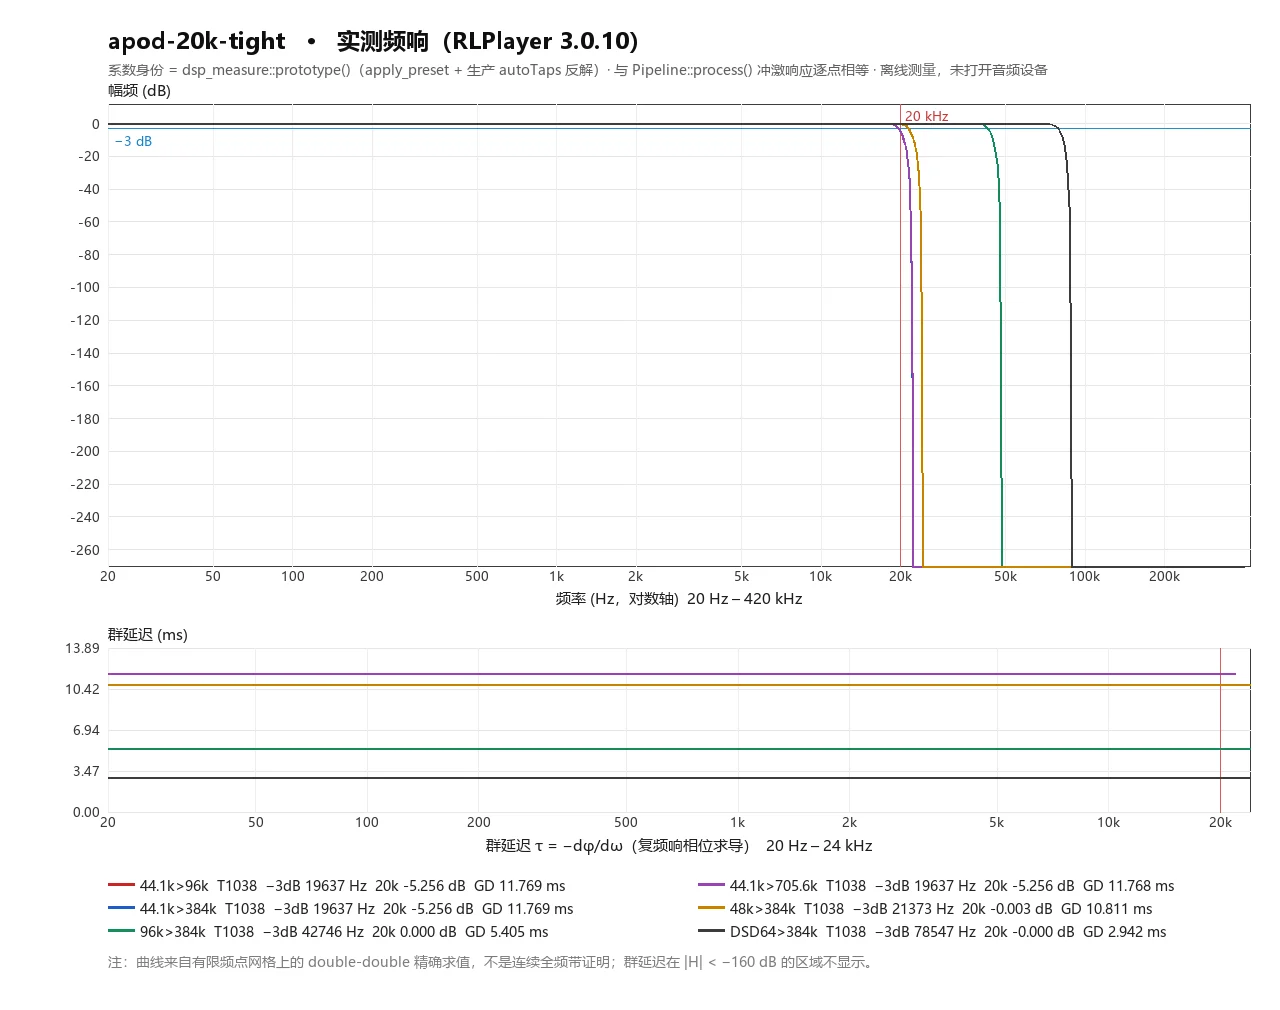
| apod-20k | 1038 | -5.256 | 19637 | -313.59 @ 98097 | 11.769 | OK |
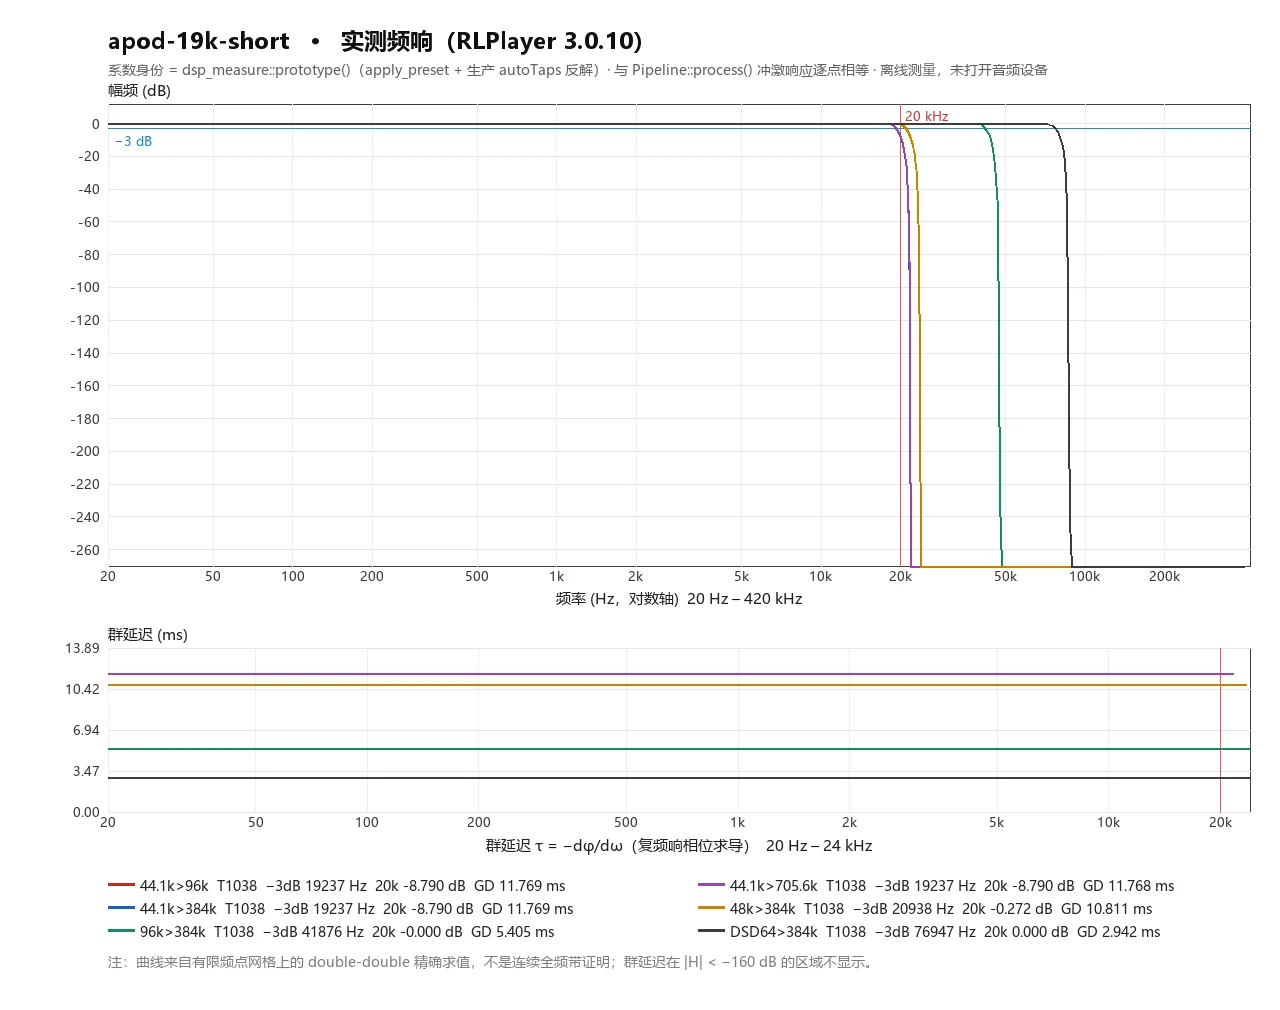
| apod-19k-short | 1038 | -8.790 | 19237 | -314.42 @ 137503 | 11.769 | OK |
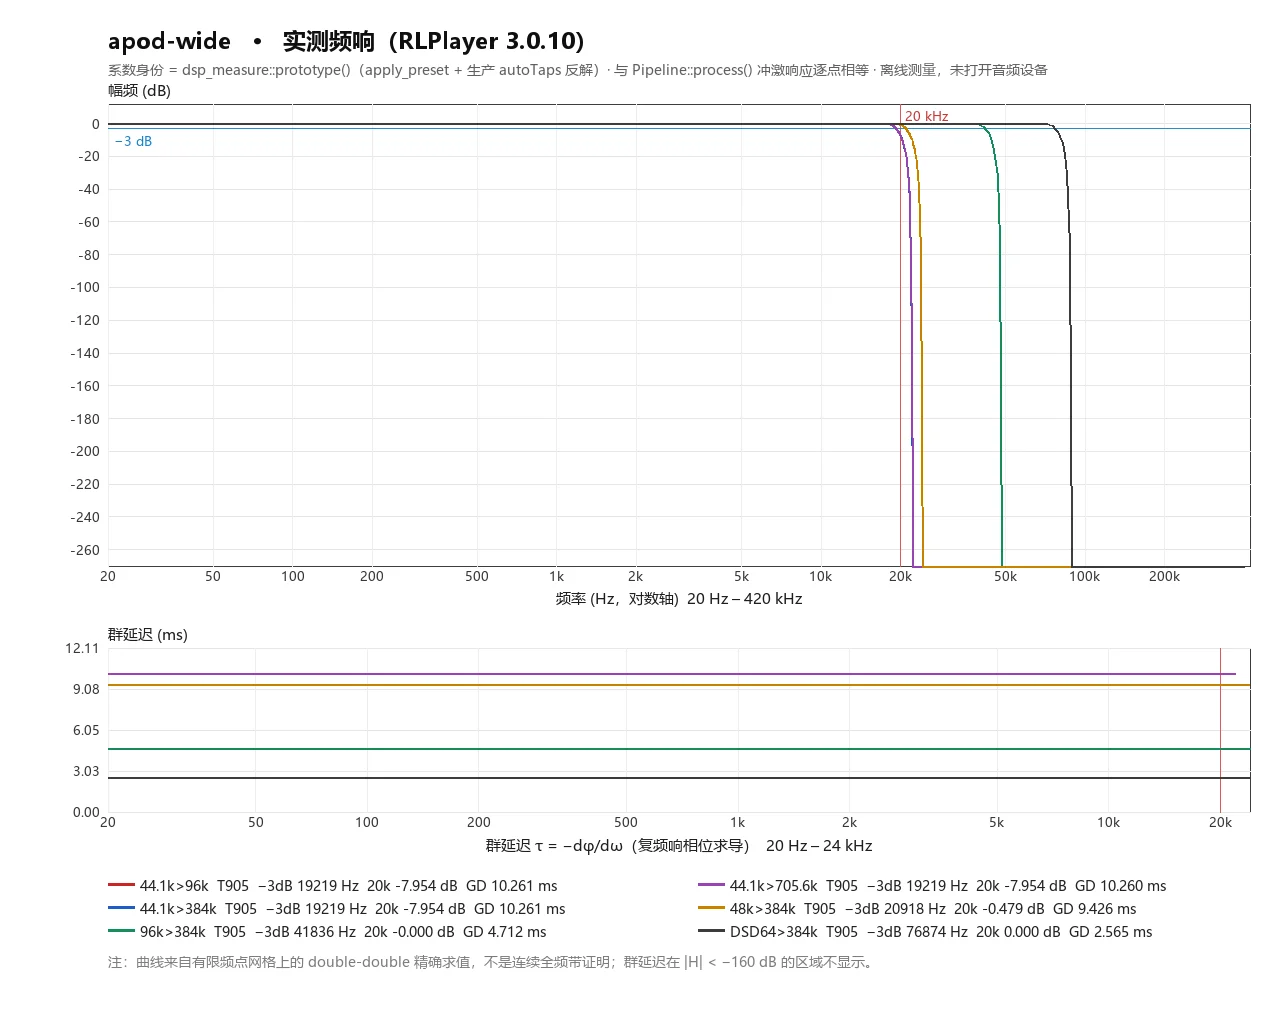
| apod-wide | 905 | -7.954 | 19219 | -314.98 @ 40482 | 10.261 | OK |
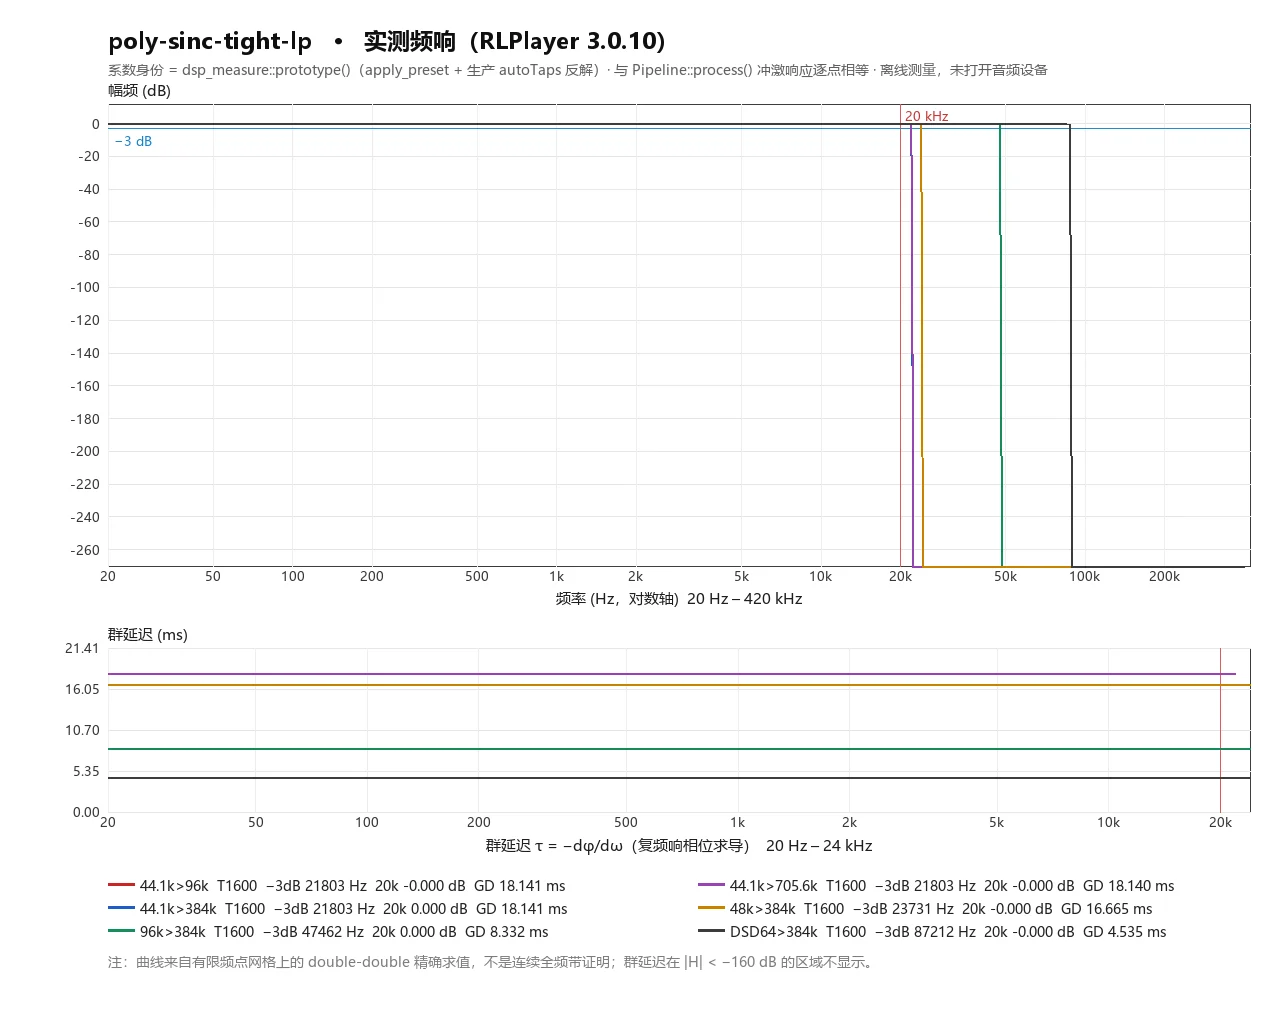
| poly-sinc-tight-lp | 1600 | 0.000 | 21803 | -288.43 @ 22516 | 18.141 | OK |
| apod-20k-tight | 1038 | -5.256 | 19637 | -313.59 @ 98097 | 11.769 | OK |
Swipe horizontally on smaller screens to view full table
A.4 Key Metrics Table: 44.1 kHz → 705.6 kHz
One preset per row. T denotes taps per phase (actual production value), not the nominal tap budget in preset tables; Min Stopband reports attenuation in dB and frequency of occurrence; status "Failed to construct" indicates the combination triggers maxPrototypeTaps = 2^21 under 3.0.10 production parameters, causing PolyphaseResampler to reject construction (refusing to silently degrade quality). Complete 14 columns (including prototype samples, passband ripple, worst passband, fsb80, pre-ringing) are archived in the bundled CSV and RESPONSE-TABLE.md.
| Preset | T | 20 kHz (dB) | −3 dB (Hz) | Min Stopband (dB) @ Hz | GD 1 kHz (ms) | Status |
|---|---|---|---|---|---|---|
| poly-sinc-short-lp | 211 | -0.035 | 20747 | -284.22 @ 24505 | 2.392 | OK |
| poly-sinc-short-mp | 211 | -0.008 | 21018 | -285.46 @ 24376 | 0.167 | OK |
| poly-sinc-short-2s | 211 | -0.035 | 20747 | -282.83 @ 24505 | 2.570 | OK |
| poly-sinc-lp | 528 | 0.000 | 21529 | -284.99 @ 22962 | 5.986 | OK |
| poly-sinc-mp | 528 | -0.000 | 21637 | -285.03 @ 22976 | 0.179 | OK |
| poly-sinc-2s | 528 | -0.000 | 21529 | -284.83 @ 23170 | 6.164 | OK |
| poly-sinc-mp-2s | 528 | -0.000 | 21637 | -285.65 @ 22979 | 0.198 | OK |
| poly-sinc-long-lp | 1409 | -0.000 | 21855 | -284.38 @ 22416 | 15.974 | OK |
| poly-sinc-long-mp | 1409 | -0.000 | 21895 | -285.47 @ 22396 | 0.194 | OK |
| poly-sinc-long-ip | 1409 | -0.000 | 21895 | -285.52 @ 22396 | 8.084 | OK |
| poly-sinc-long-2s | 1409 | 0.000 | 21855 | -283.68 @ 22417 | 16.153 | OK |
| poly-sinc-xl | 2877 | -0.000 | 21947 | -285.58 @ 22249 | 32.618 | OK |
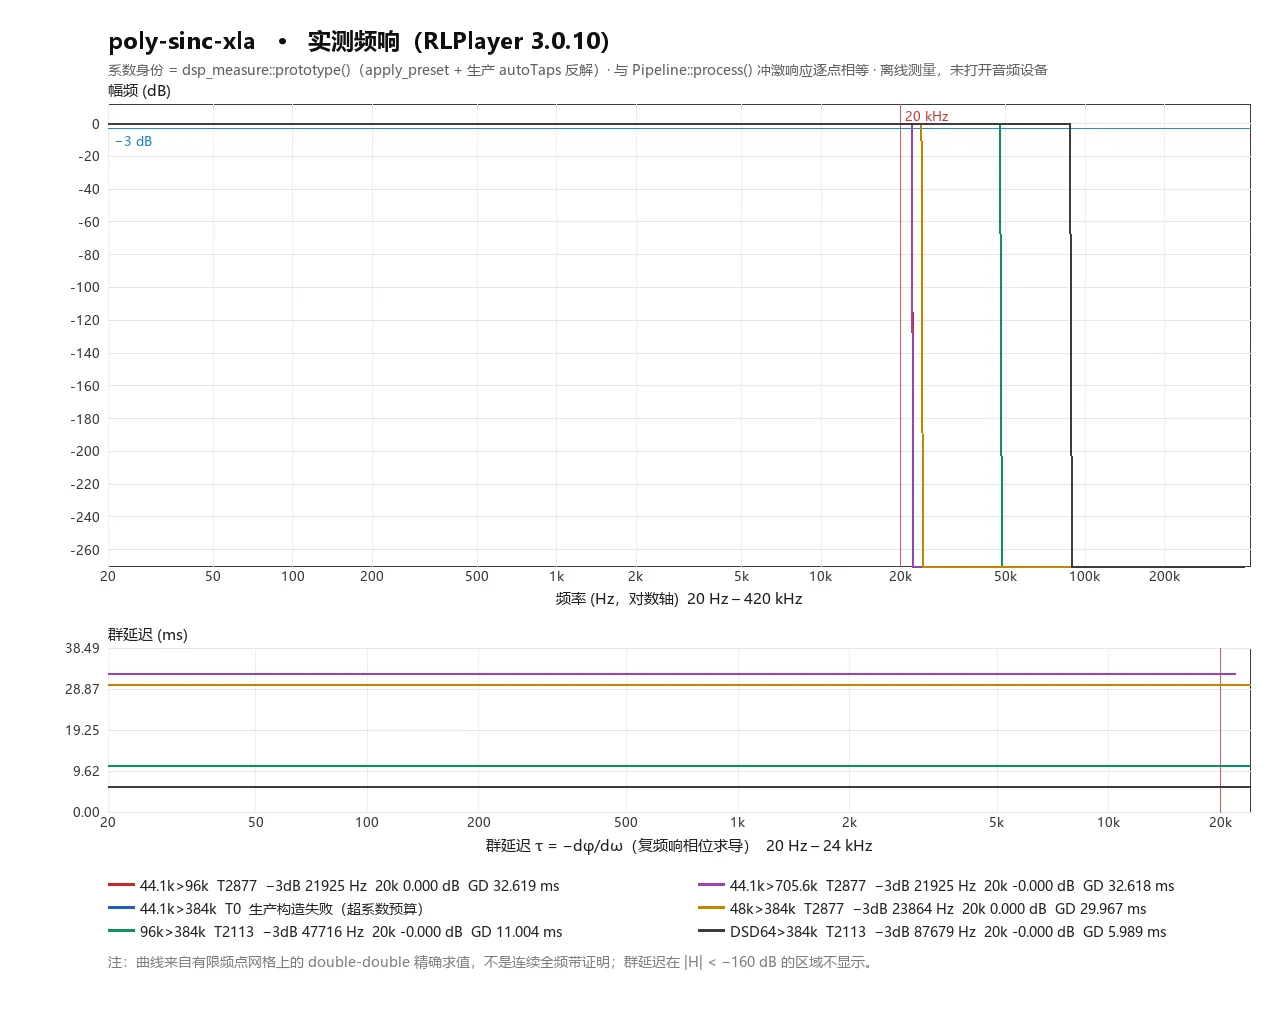
| poly-sinc-xla | 2877 | -0.000 | 21925 | -286.94 @ 22280 | 32.618 | OK |
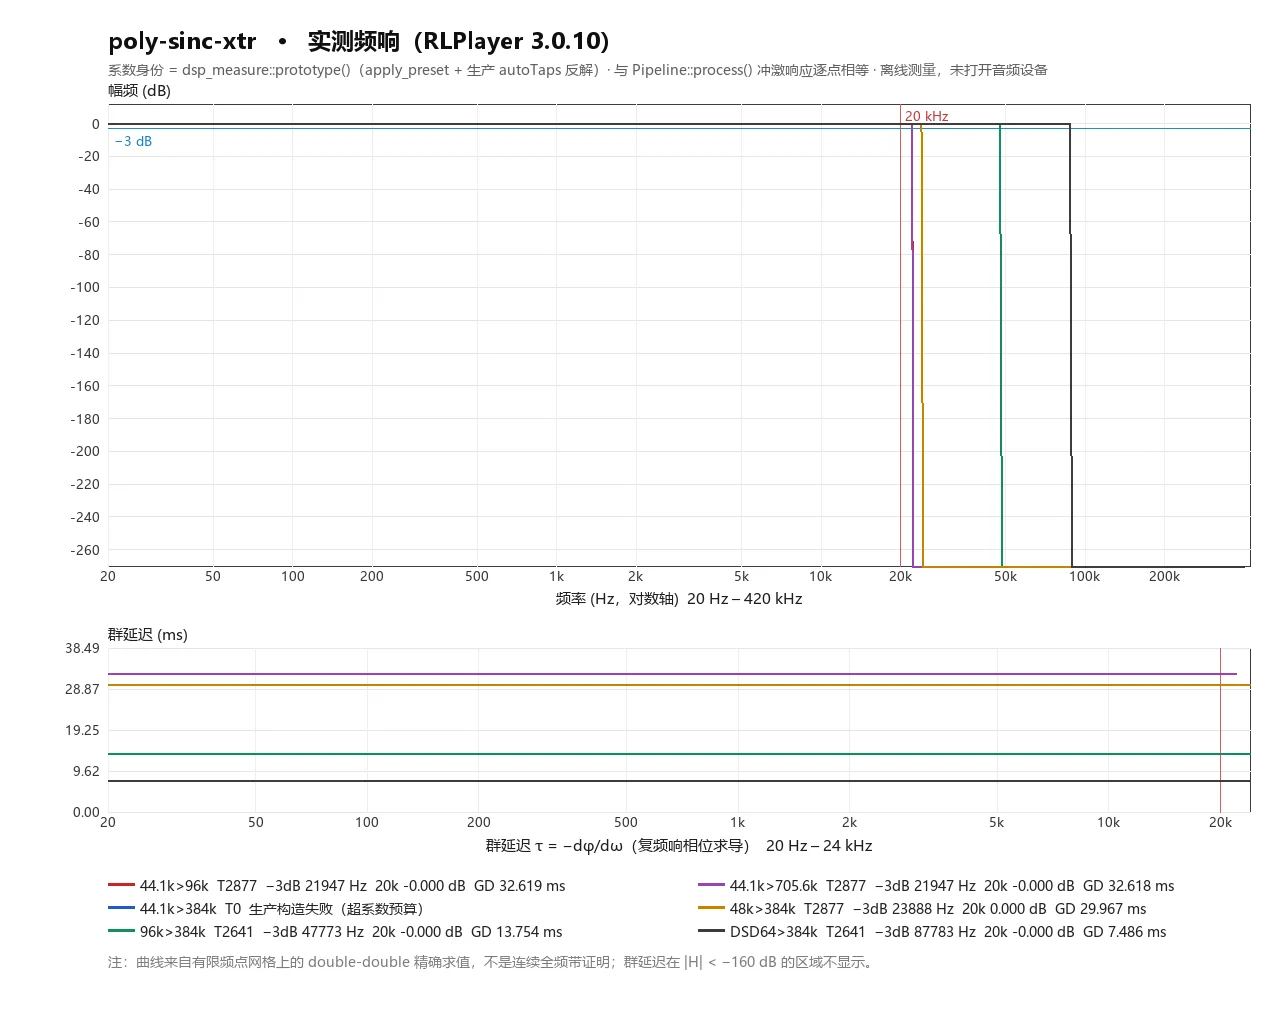
| poly-sinc-xtr | 2877 | -0.000 | 21947 | -285.58 @ 22249 | 32.618 | OK |
| poly-sinc-ext2-short | 352 | 0.000 | 21268 | -285.32 @ 23420 | 3.990 | OK |
| poly-sinc-ext2-medium | 704 | -0.000 | 21659 | -285.32 @ 22785 | 7.981 | OK |
| poly-sinc-ext2-long | 1409 | -0.000 | 21855 | -284.38 @ 22416 | 15.974 | OK |
| poly-sinc-ext2-hires-lp | 264 | -0.000 | 21008 | -285.32 @ 23880 | 2.992 | OK |
| poly-sinc-ext2-hires-ip | 264 | -0.000 | 21225 | -284.60 @ 23902 | 1.582 | OK |
| poly-sinc-ext2-hires-mp | 264 | -0.000 | 21225 | -284.65 @ 23902 | 0.171 | OK |
| poly-sinc-xtr-lp | 2877 | -0.000 | 21947 | -285.58 @ 22249 | 32.618 | OK |
| poly-sinc-xtr-mp | 423 | -0.000 | 21534 | -285.45 @ 23207 | 0.176 | OK |
| poly-sinc-xtr-short-lp | 211 | -0.035 | 20747 | -284.22 @ 24505 | 2.392 | OK |
| poly-sinc-xtr-short-mp | 211 | -0.008 | 21018 | -285.46 @ 24376 | 0.167 | OK |
| poly-sinc-gauss-medium | 1023 | 0.000 | 21138 | -125.43 @ 23843 | 11.598 | OK |
| poly-sinc-gauss-halfband | 714 | -5.256 | 19637 | -196.03 @ 25700 | 8.095 | OK |
| poly-sinc-gauss-halfband-s | 622 | -7.954 | 19219 | -196.61 @ 26311 | 7.051 | OK |
| poly-sinc-hb-xs | 132 | -3.265 | 19966 | -286.06 @ 25711 | 1.496 | OK |
| poly-sinc-ext | 845 | 0.000 | 21724 | -285.80 @ 22796 | 9.580 | OK |
| poly-sinc-mqa/mp3-lp | 151 | -1.529 | 20227 | -283.58 @ 25232 | 1.711 | OK |
| poly-sinc-mqa/mp3-mp | 151 | -0.510 | 20606 | -285.59 @ 25302 | 0.162 | OK |
| sinc-short | 211 | -0.035 | 20747 | -284.22 @ 24505 | 2.392 | OK |
| sinc-medium | 423 | 0.000 | 21399 | -284.63 @ 23186 | 4.795 | OK |
| sinc-long | 1057 | 0.000 | 21790 | -284.33 @ 22505 | 11.983 | OK |
| sinc-long-h | 1038 | -5.256 | 19637 | -297.95 @ 232279 | 11.768 | OK |
| sinc-Mx | 1761 | 0.000 | 21894 | -285.04 @ 22323 | 19.965 | OK |
| sinc-MGa | 32767 | -0.000 | 21884 | -167.30 @ 22381 | 371.507 | OK |
| sinc-Ls | 704 | -0.000 | 21659 | -285.32 @ 22785 | 7.981 | OK |
| sinc-Lm | 704 | -0.000 | 21741 | -285.16 @ 22744 | 0.182 | OK |
| sinc-Lh | 1038 | -8.790 | 19237 | -297.94 @ 232106 | 11.768 | OK |
| minringFIR-lp | 176 | -0.425 | 20487 | -285.20 @ 24785 | 1.995 | OK |
| poly-sinc-gauss-short | 255 | -0.001 | 20617 | -106.06 @ 24712 | 2.890 | OK |
| poly-sinc-gauss-long | 2047 | -0.000 | 21483 | -139.01 @ 23158 | 23.208 | OK |
| poly-sinc-gauss-mp | 2047 | -0.000 | 21490 | -199.58 @ 23174 | 0.137 | OK |
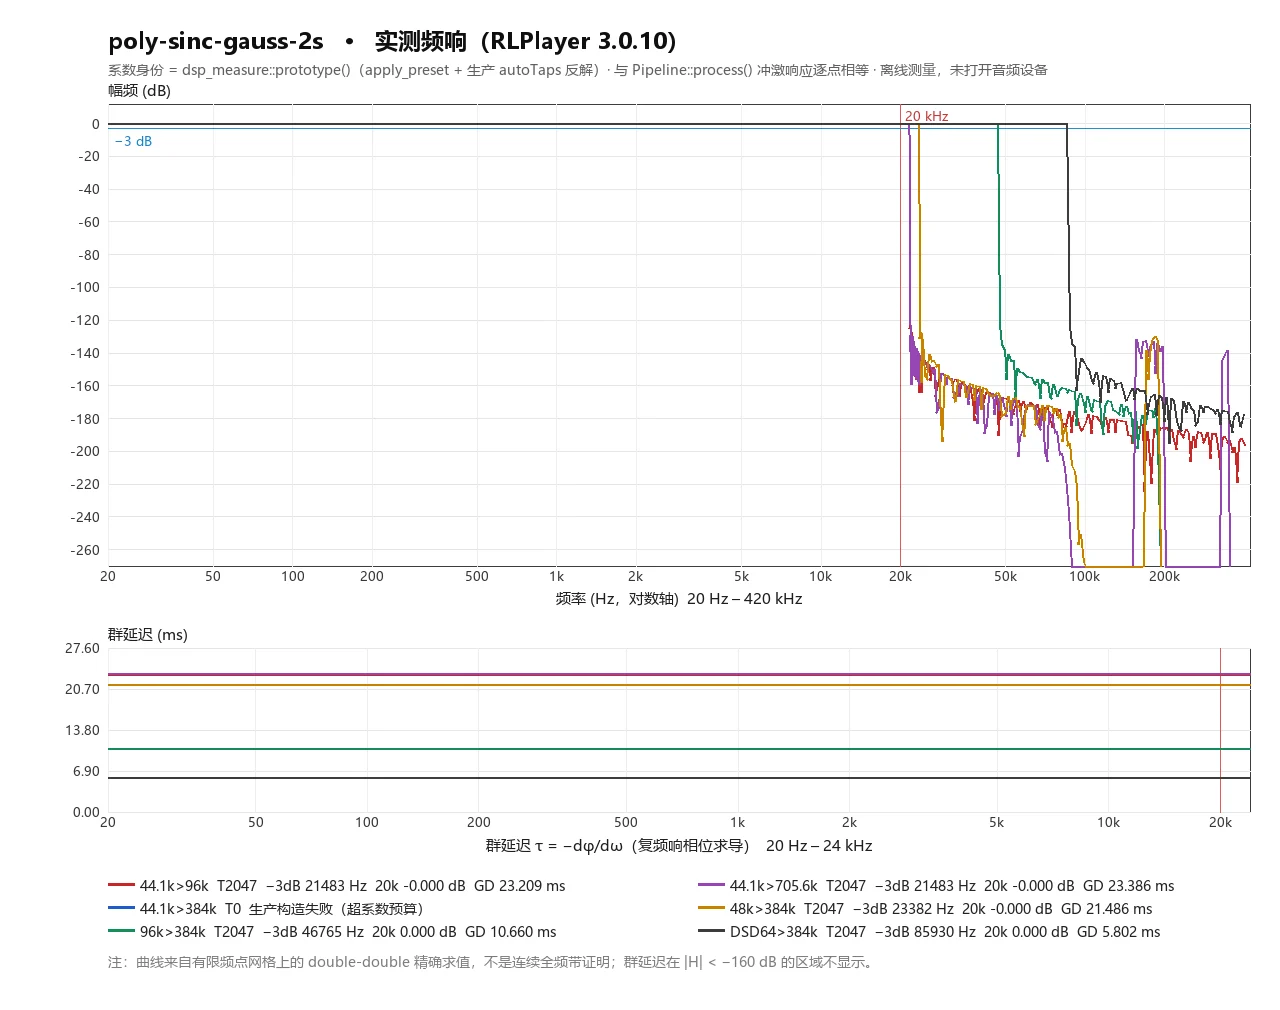
| poly-sinc-gauss-2s | 2047 | -0.000 | 21483 | -130.70 @ 155436 | 23.386 | OK |
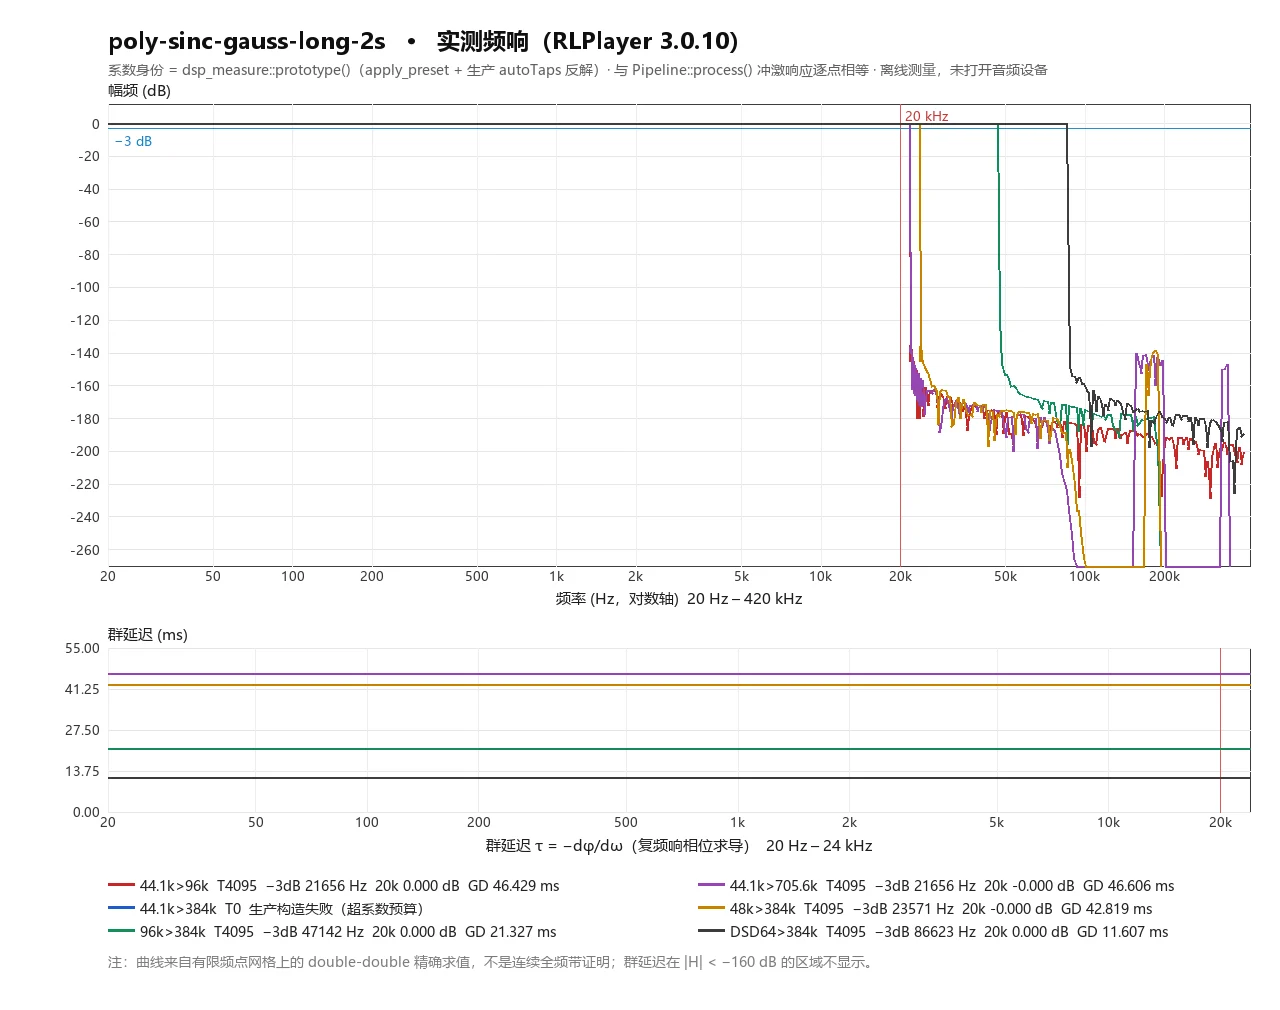
| poly-sinc-gauss-long-2s | 4095 | -0.000 | 21656 | -139.22 @ 155454 | 46.606 | OK |
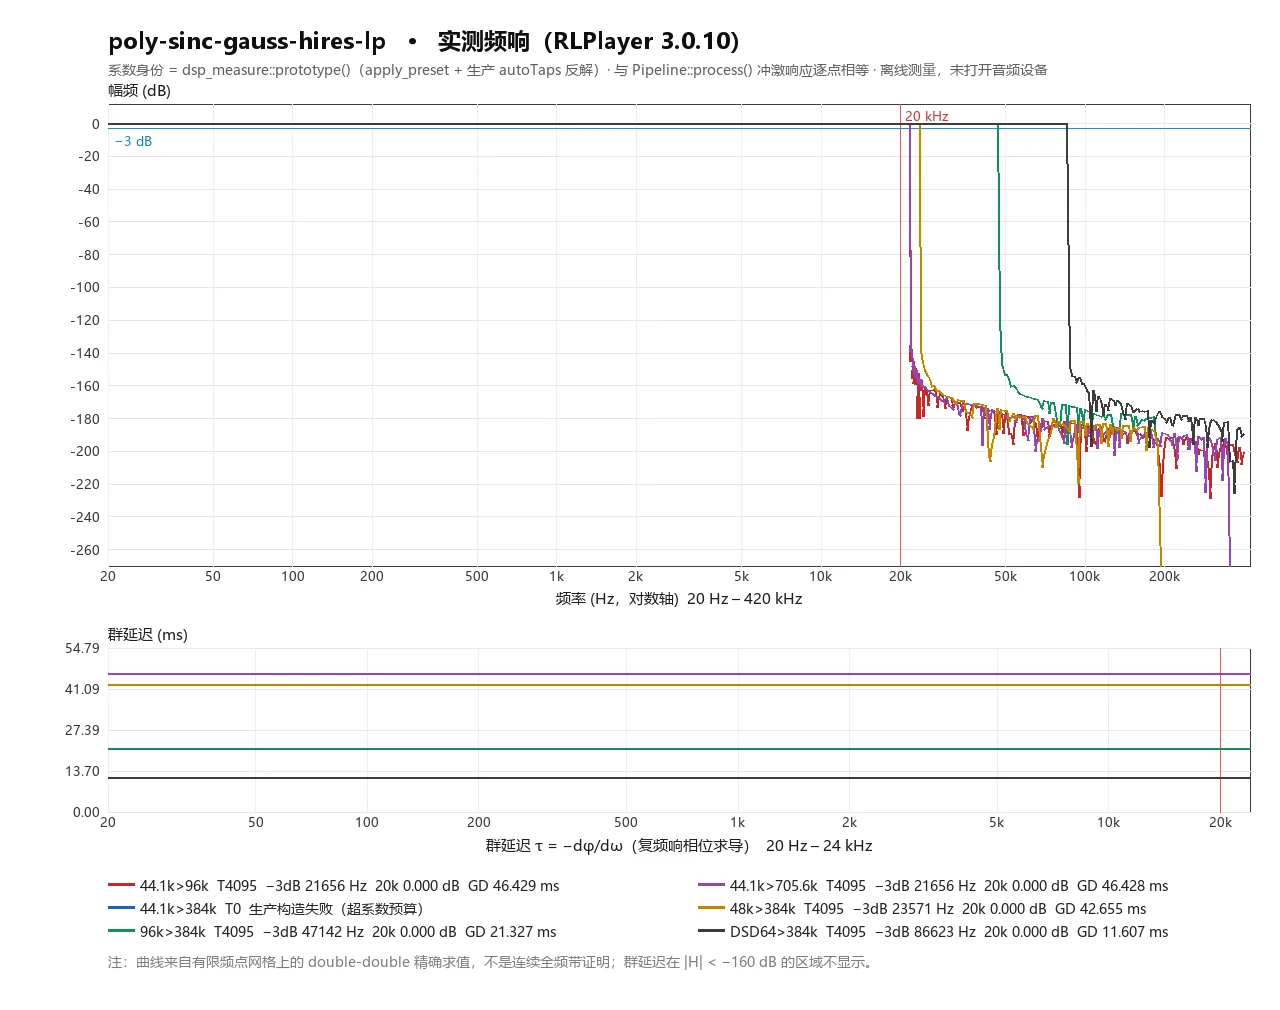
| poly-sinc-gauss-hires-lp | 4095 | 0.000 | 21656 | -149.99 @ 22827 | 46.428 | OK |
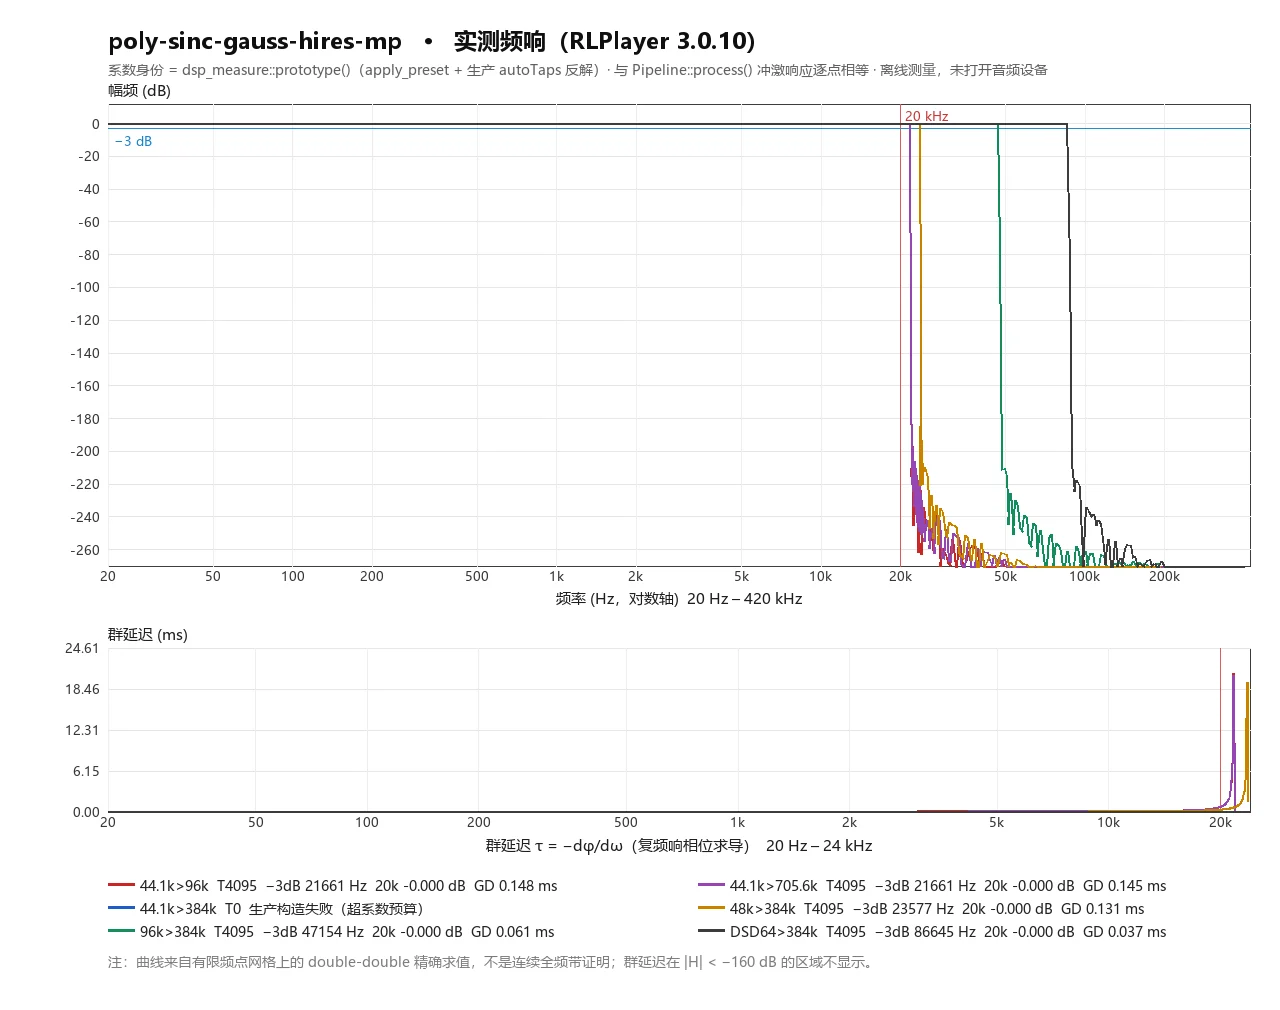
| poly-sinc-gauss-hires-mp | 4095 | -0.000 | 21661 | -211.67 @ 22827 | 0.145 | OK |
| poly-sinc-gauss-hires-ip | 4095 | -0.000 | 21661 | -211.75 @ 22827 | 23.287 | OK |
| poly-sinc-gauss-xl | 32767 | -0.000 | 21773 | -169.56 @ 22602 | 371.507 | OK |
| poly-sinc-gauss-xla | 32767 | 0.000 | 21718 | -166.76 @ 22712 | 371.507 | OK |
| poly-sinc-ext2 | 704 | -0.000 | 21659 | -285.32 @ 22785 | 7.981 | OK |
| poly-sinc-ext2-2s | 704 | -0.000 | 21659 | -283.84 @ 22734 | 8.160 | OK |
| poly-sinc-ext2-xl | 1409 | -0.000 | 21855 | -284.38 @ 22416 | 15.974 | OK |
| poly-sinc-ext2-xla | 1174 | 0.000 | 21816 | -285.00 @ 22459 | 13.310 | OK |
| poly-sinc-hb | 106 | -7.613 | 19446 | -285.37 @ 28338 | 1.201 | OK |
| poly-sinc-hb-s | 85 | -13.179 | 18796 | -283.32 @ 27700 | 0.963 | OK |
| poly-sinc-hb-m | 141 | -2.333 | 20096 | -283.80 @ 25711 | 1.598 | OK |
| poly-sinc-hb-l | 211 | -0.035 | 20747 | -284.22 @ 24505 | 2.392 | OK |
| poly-sinc-hb-2s | 132 | -3.268 | 19965 | -283.45 @ 27132 | 1.674 | OK |
| poly-sinc-hb-s-2s | 96 | -9.856 | 19183 | -282.08 @ 28596 | 1.266 | OK |
| poly-sinc-hb-m-2s | 151 | -1.532 | 20226 | -283.65 @ 25485 | 1.890 | OK |
| poly-sinc-hb-l-2s | 264 | -0.000 | 21008 | -284.48 @ 24580 | 3.171 | OK |
| sinc-S | 845 | 0.000 | 21724 | -285.80 @ 22796 | 9.580 | OK |
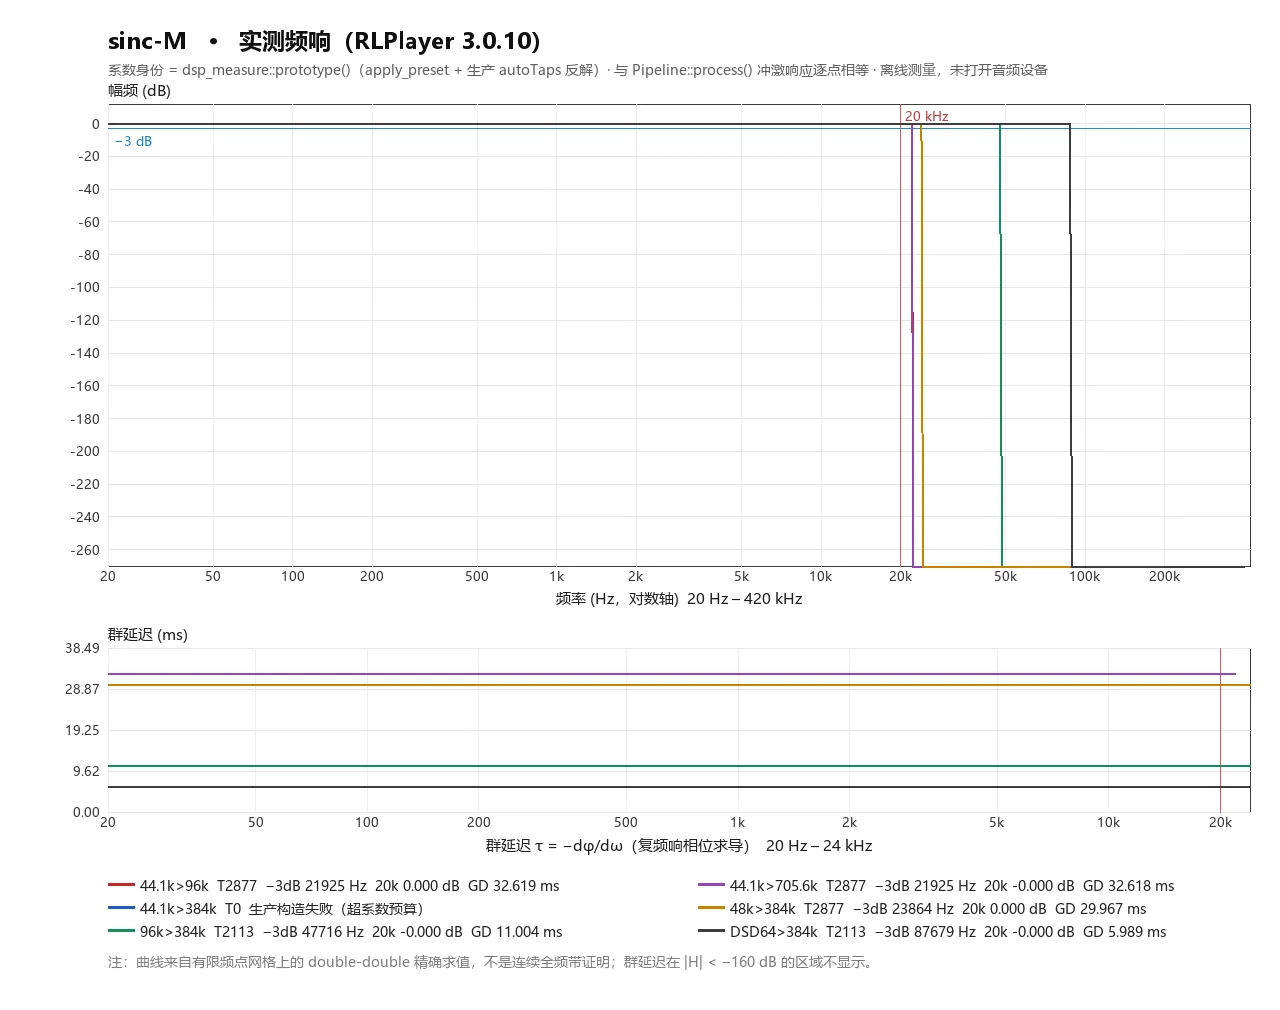
| sinc-M | 2877 | -0.000 | 21925 | -286.94 @ 22280 | 32.618 | OK |
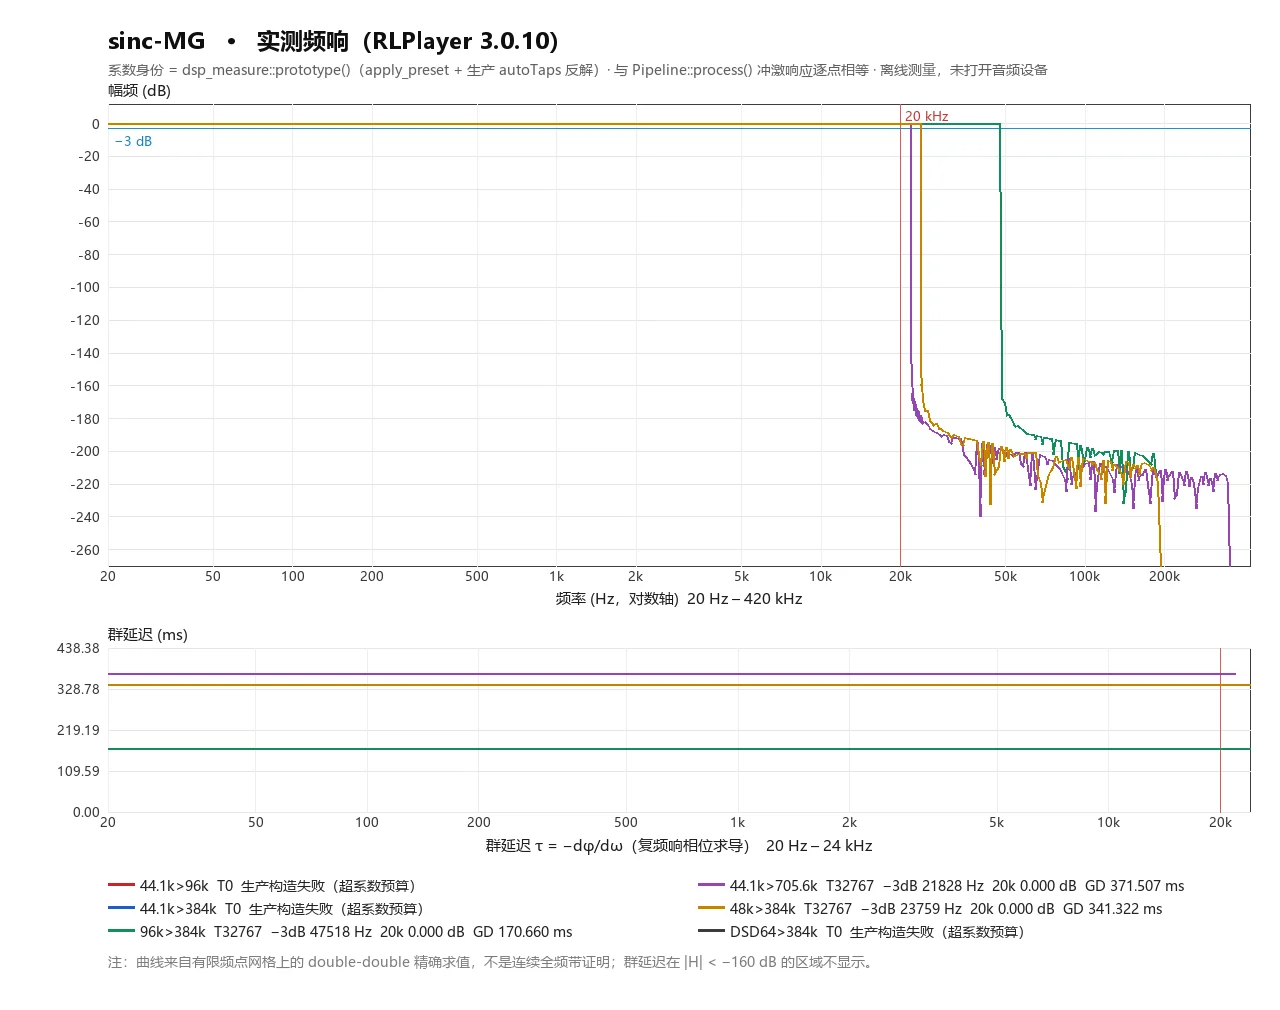
| sinc-MG | 32767 | 0.000 | 21828 | -167.57 @ 22492 | 371.507 | OK |
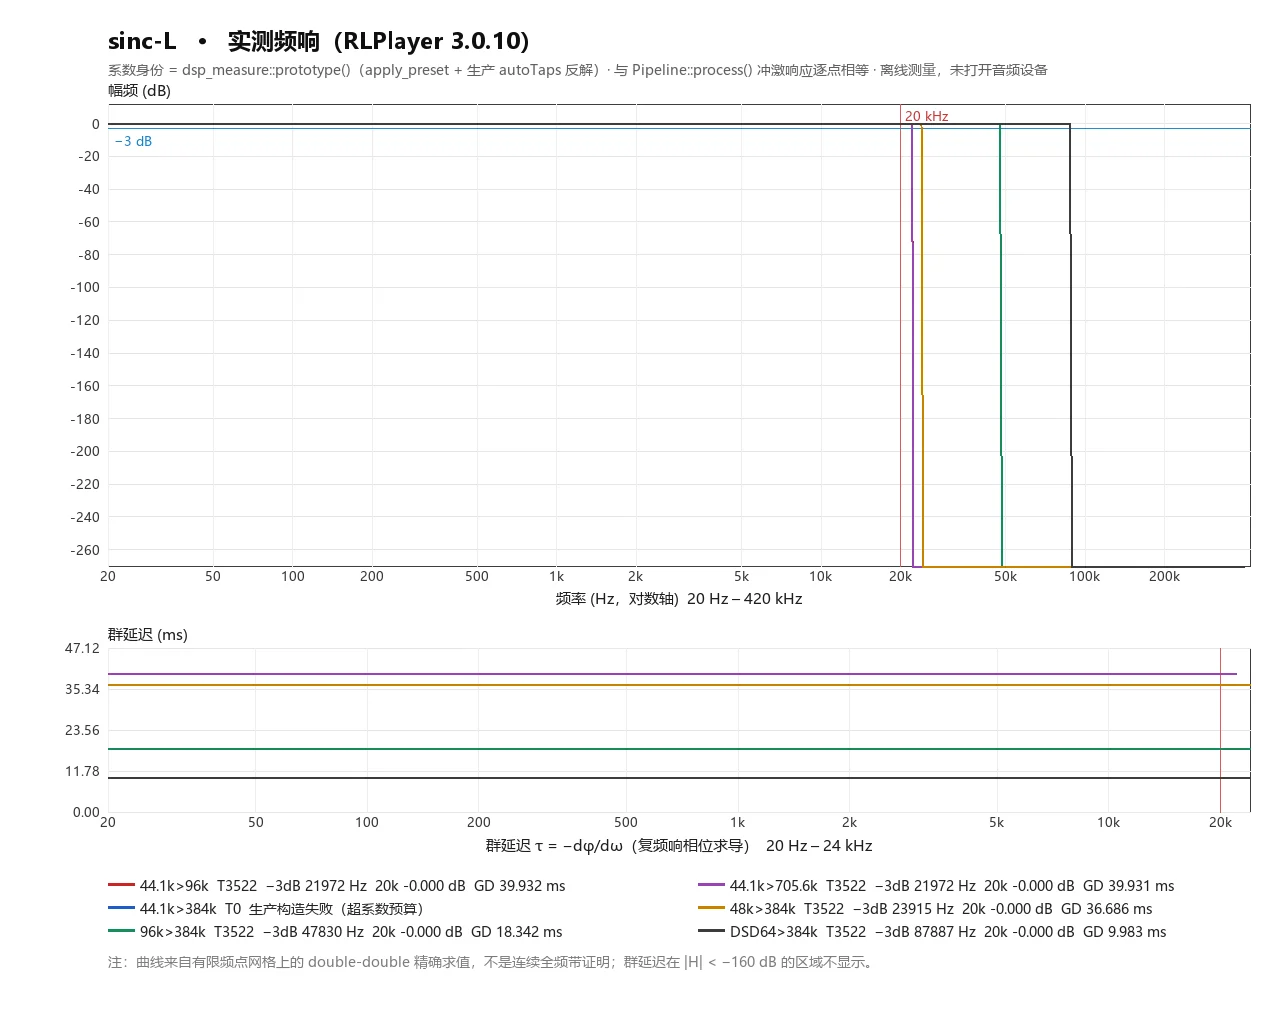
| sinc-L | 3522 | -0.000 | 21972 | -284.54 @ 22207 | 39.931 | OK |
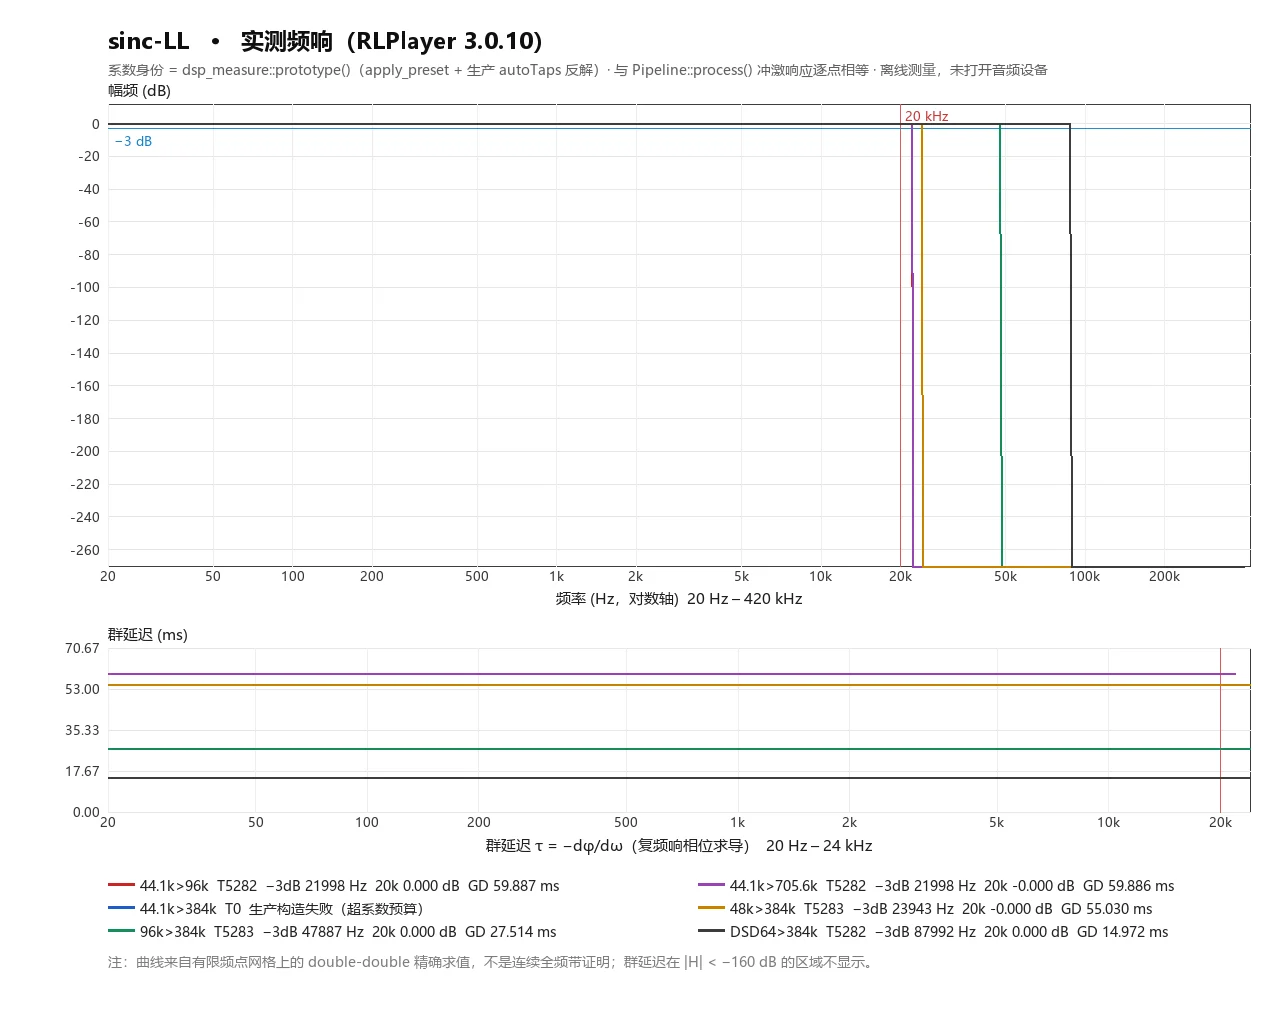
| sinc-LL | 5282 | -0.000 | 21998 | -284.58 @ 22142 | 59.886 | OK |
| closed-form-fast | 211 | -0.035 | 20747 | -284.22 @ 24505 | 2.392 | OK |
| closed-form | 352 | 0.000 | 21268 | -285.32 @ 23420 | 3.990 | OK |
| closed-form-M | 2877 | -0.000 | 21947 | -285.58 @ 22249 | 32.618 | OK |
| closed-form-16M | 7043 | -0.000 | 22011 | -283.83 @ 136610 | 79.852 | OK |
| minringFIR | 75 | -16.058 | 18399 | -283.01 @ 28483 | 0.850 | OK |
| minringFIR-mp | 75 | -7.258 | 19161 | -286.72 @ 28661 | 0.150 | OK |
| apod-20k | 1038 | -5.256 | 19637 | -297.95 @ 232279 | 11.768 | OK |
| apod-19k-short | 1038 | -8.790 | 19237 | -297.94 @ 232106 | 11.768 | OK |
| apod-wide | 905 | -7.954 | 19219 | -301.85 @ 31503 | 10.260 | OK |
| poly-sinc-tight-lp | 1600 | -0.000 | 21803 | -286.66 @ 22491 | 18.140 | OK |
| apod-20k-tight | 1038 | -5.256 | 19637 | -297.95 @ 232279 | 11.768 | OK |
Swipe horizontally on smaller screens to view full table
A.5 Per-Preset Measured Curves (79 Plots)
Each plot features two panels: Upper panel shows amplitude response (20 Hz – 420 kHz, logarithmic horizontal axis, 6 overlay sample rate pairs, highlighting 20 kHz and −3 dB); lower panel shows group delay τ = −dφ/dω (20 Hz – 24 kHz). Legends report T, −3 dB, 20 kHz, and group delay for each combination; failed combinations are marked "Construction Failed (Exceeds Coefficient Budget)" without drawing curves. Captions match RESPONSE-TABLE.md and body tables verbatim.
A.6 Documented Construction Failures in Production Paths
The following identities cannot construct filters under 3.0.10 production parameters: triggering maxPrototypeTaps = 2^21, where PolyphaseResampler throws "Requested FIR exceeds the coefficient budget; quality was not reduced. Use a cascade or explicitly raise maxPrototypeTaps.". End-to-end replication using the factory 3.0.10 release rtaplay.exe (all-zero silence, --analyze offline without initializing devices) confirms: poly-sinc-short-lp exits normally with code 0; poly-sinc-xl and poly-sinc-gauss-long crash with 0xC0000409 with zero output. This is a known limitation rather than a measurement error; the measurement tool in this appendix explicitly rejects construction and documents the failure rather than silently degrading quality.
| Combination | Failures | Preset |
|---|---|---|
| 44.1 kHz → 96 kHz | 5 | sinc-MGa、poly-sinc-gauss-xl、poly-sinc-gauss-xla、sinc-MG、closed-form-16M |
| 44.1 kHz → 384 kHz | 21 | poly-sinc-xl、poly-sinc-xla、poly-sinc-xtr、poly-sinc-xtr-lp、sinc-Mx、sinc-MGa、poly-sinc-gauss-long、poly-sinc-gauss-mp、poly-sinc-gauss-2s、poly-sinc-gauss-long-2s、poly-sinc-gauss-hires-lp、poly-sinc-gauss-hires-mp、poly-sinc-gauss-hires-ip、poly-sinc-gauss-xl、poly-sinc-gauss-xla、sinc-M、sinc-MG、sinc-L、sinc-LL、closed-form-M、closed-form-16M |
| DSD64 → PCM 176.4 kHz → 384 kHz | 5 | sinc-MGa、poly-sinc-gauss-xl、poly-sinc-gauss-xla、sinc-MG、closed-form-16M |
Swipe horizontally on smaller screens to view full table
A.7 Limitations & Unverified Items
| Item | Status | Bottleneck / Explanation |
|---|---|---|
| Continuous Full-Band Proof | Unproven | All figures derive from finite frequency grids; inter-grid peaks could theoretically be missed |
| DSD Decimation Filter | Unverified | This appendix benchmarks from PCM 176.4 kHz upward, excluding the DSD→PCM decimation stage |
| Quantization / Dither / SDM | Excluded | Evaluates resampling filters exclusively (unquantized double output) |
| Failure Manifestation under GUI Paths | Unverified | CLI crashes verified; GUI testing requires a live physical WebView2 session, not conducted in this round (non-UI task) |
| Over-Budget Combinations Under Uncapped Budgets | See raw/metrics-*-supp.tsv | Marked NON_PRODUCTION_BUDGET for reference only; does not reflect production behavior |
| Auditory Impressions | Not Applicable | Objective physical metrics; contains no subjective auditory claims |
Swipe horizontally on smaller screens to view full table